





Clinical synthesis on rehabilitation after a stroke: what the evidence really says about dose, upper limb techniques, walking and the complications to screen for. Every reference has been individually verified on PubMed.
📝 In brief: clinical synthesis
- Stroke is a rehabilitation challenge on a population scale: in 2021 there were 11.9 million new strokes and 93.8 million people living with the after-effects; stroke was the 3rd leading cause of death (7.3 million, 10.7% of all deaths) and the 4th leading cause of disability-adjusted life years (160.5 million DALYs) 1.
- Earlier and more intense is not better: the AVERT trial (2,104 patients, 56 stroke units, 5 countries) showed that very early, high-dose mobilisation within 24 h reduced the chances of a favourable outcome at 3 months (modified Rankin Scale 0-2: 46% versus 50%; adjusted OR 0.73; 95% CI 0.59-0.90; p = 0.004) 14. The dose-response analysis sharpens the message: increasing the daily frequency of out-of-bed episodes improves outcome (OR 1.13; 95% CI 1.09-1.18) whereas increasing the minutes of mobilisation per day worsens it (OR 0.94; 95% CI 0.91-0.97): shorter and more frequent sessions in the acute phase 15.
- The dose actually delivered in a session is very low: across 312 timed physiotherapy and occupational therapy sessions, practice of functional upper limb movement occurred in only 51% of sessions targeting the arm, with 32 repetitions on average (95% CI 20-44); walking was practised in 84% of sessions, with 357 steps on average (95% CI 296-418): a low dose set against animal models of plasticity 22. Increasing the amount of rehabilitation improves activities (SMD 0.39; 95% CI 0.07-0.71), but the useful supplement is considerable: at least +240% 23.
- Repetitive task-oriented training improves function, modestly but consistently: arm function SMD 0.25 (95% CI 0.01-0.49; 11 studies, 749 participants), hand function SMD 0.25 (95% CI 0.00-0.51), walking distance +34.80 metres (95% CI 18.19-51.41; 9 studies, 610 participants), across 33 trials and 1,853 participants; benefits maintained up to 6 months, and not modified by the type of intervention, the dose of practice or the time since stroke 13.
- Fitness training is one of the best-supported interventions, and it is safe: across 75 trials and 3,017 participants, cardiorespiratory training reduces disability (SMD 0.52; 95% CI 0.19-0.84; moderate certainty) and increases peak VO2 by 3.40 mL/kg/min (95% CI 2.98-3.83); mixed training also reduces disability (SMD 0.23; 95% CI 0.03-0.42). No deaths were influenced (all risk differences 0.00) and no serious adverse events were reported 21.
- Constraint-induced therapy and robotics: real effects, not to be oversold. CIMT improves arm motor function (SMD 0.34; 95% CI 0.12-0.55; p = 0.004; 28 studies, 858 participants) but does not convincingly reduce disability (SMD 0.24; 95% CI -0.05 to 0.52; and SMD -0.20; 95% CI -0.57 to 0.16 at follow-up) across 42 trials and 1,453 participants 26. Electromechanical gait training combined with physiotherapy doubles the odds of independent walking (OR 2.01; 95% CI 1.51-2.69; high-quality evidence), but it is non-ambulatory patients and those within the first three months who benefit 11.
- Prognosis is framed early, and the “70% rule” is not something to prescribe: the PREP2 algorithm, developed on 207 patients recruited within 3 days (upper limb impairment, age, motor evoked potentials on TMS, MRI lesion load or NIHSS), correctly predicts arm function at 3 months in 75% of patients, TMS being needed in only a third of them 18. Conversely, the proportional recovery rule (recovery ≈ 0.70 × initial deficit, obtained after excluding the “non-fitters”, which raised the explained variance from 47% to 89%) 16 is confounded by mathematical coupling and by compression towards the ceiling of the scale 17 : the average trajectory does not predict the patient in front of you.
- Non-motor complications are the rule, not the exception, and they shape the session: dysphagia 46.6% (95% CI 40.5-52.8), with 32.1% pneumonia among those with dysphagia 4 ; post-stroke fatigue 46.79% (95% CI 43.41-50.18) 5 ; depression 27% (95% CI 25-30), of which 71% begin within 3 months 8 ; spatial neglect 29%, detected far better by ecological assessments than by tabletop tests (53% vs 24%) 7 ; spasticity 25.3% 9 ; hemiplegic shoulder pain, prevalence 22 to 47% 10. Hence the framework set out by the AHA/ASA guidelines: rehabilitation demands a sustained and coordinated effort from a large team, and comprehensive programmes with adequate resources, dose and duration must be a priority 3.
🧠 What are the fundamentals to know about stroke and its recovery?
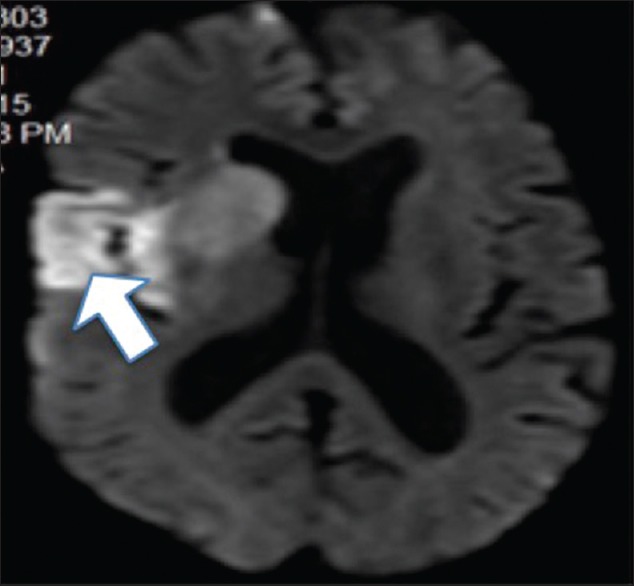
MRIDiffusion-weighted brain MRI, axial slice: early right middle cerebral artery infarct, extensive high signal indicated by an arrow.
Source : Thapa et al., Journal of neurosciences in rural practice, 2016, figure 1 · CC BY-NC-SA
🏥 The most effective intervention is not a technique: it is an organisation
Being managed by a dedicated multidisciplinary team changes outcome, independently of age, sex and initial severity.
Odds ratio 0.77 (95% CI 0.69–0.87) across 29 randomised trials and 5,902 participants, versus a conventional ward. Patients are more likely to be alive, independent and living at home one year later. Source: Langhorne et al., Cochrane review 2020 (PMID 32324916).
🌍 What stroke weighs worldwide
11.9 million new strokes in 2021, and 93.8 million people living today with the after-effects. Rehabilitation is not an optional extra: it is the substance of the journey for those 93.8 million.
2021 data: 7.3 million deaths and 160.5 million DALYs attributable to stroke. Source: GBD 2021 Stroke Risk Factor Collaborators, 2024 (PMID 39304265).
Before talking about rehabilitation technique, the scene has to be set: who are we talking about, what becomes of these patients, which after-effects do we actually meet in the clinic or on the ward, and above all, since it conditions everything else, what can honestly be said about recovery and how predictable it is. This section brings together the solid quantitative landmarks and flags, wherever necessary, the points on which the literature does not allow a verdict.
Epidemiology: a leading global burden
Stroke remains one of the main sources of acquired disability worldwide. The Global Burden of Disease 2021 data give the scale of the problem 1 :
The same analysis places stroke as the 3rd leading cause of death worldwide (7.3 million deaths, i.e. 10.7% of all deaths) and the 4th leading cause of disability-adjusted life years (160.5 million DALYs, 5.6% of the total) 1. That last figure speaks loudest to a rehabilitation professional: stroke weighs not only through mortality, but through the years lived with disability. That is precisely the territory of physiotherapy.
For the physiotherapist in private practice as in hospital, the translation is simple: the population living with the after-effects (93.8 million) is eight times larger than the population having a stroke each year. Post-stroke rehabilitation is not a niche acute activity, it is a long-haul one.
What becomes of survivors? The weight of how care is organised
A patient's outcome does not depend only on their lesion: it also depends, and measurably so, on the way care is organised around them. The Cochrane review of stroke units (29 randomised trials, 5,902 participants) shows that management in an organised stroke unit, provided by a dedicated multidisciplinary team, reduces the risk of a poor outcome by about 23% compared with care on a conventional ward: odds ratio 0.77 (95% CI 0.69 to 0.87) moderate-quality evidence. Patients managed in this way are more likely to be alive, independent and living at home one year after the stroke, and this benefit is independent of age, sex and initial severity 2.
This result is not incidental for the physiotherapist: it is a reminder that the effective unit of intervention is not the isolated professional, but the team. The landmark AHA/ASA guidelines on adult stroke rehabilitation are explicit on this point: rehabilitation “requires a sustained and coordinated effort from a large team”, including the patient and their goals, their family, carers, doctors, nurses, physiotherapists, occupational therapists, speech and language therapists, psychologists, dietitians and social workers. And above all: without communication and coordination between these actors, isolated rehabilitation efforts are unlikely to reach their full potential 3.
“The provision of comprehensive rehabilitation programmes with adequate resources, dose and duration is an essential aspect of stroke care and should be a priority.”, AHA/ASA guidelines 3
The after-effects: motor, but not only
The reflex is to think hemiplegia. Clinical reality is considerably broader, and some of the most frequent after-effects are invisible to the clinician who does not look for them. Here are the documented orders of magnitude:
| After-effect / complication | Documented frequency | Source |
|---|---|---|
| Dysphagia | 46.6% (95% CI 40.5–52.8); 43.6% after ischaemic stroke, 58.8% after haemorrhagic stroke | Song et al. 2024 |
| Post-stroke fatigue | 46.79% (95% CI 43.41–50.18); 53.19% in women; 57.54% after haemorrhagic stroke | Zhan et al. 2023 |
| Falls | from 7% in the first week to 73% in the first year | Denissen et al. 2019 |
| Unilateral spatial neglect | 29% (38% after a right-hemisphere lesion, 18% after a left-hemisphere lesion) | Esposito et al. 2021 |
| Depression | 27% at some point (95% CI 25–30); cumulative incidence at 1 year: 38% | Liu et al. 2023 |
| Spasticity | 25.3% across all strokes; 39.5% in patients with paresis; 9.4% severe/disabling spasticity | Zeng et al. 2021 |
| Hemiplegic shoulder pain | incidence 10–22%; prevalence 22–47% | Anwer & Alghadir 2020 |
Three of these rows deserve a practical comment.
Neglect is easily missed. Key point: ecological assessments, tied to activities of daily living, detect far more cases than tabletop tests disconnected from everyday life: 53% versus 24% 7. In other words, a normal pen-and-paper assessment does not rule out neglect. If the patient bumps into door frames on the left, believe the corridor rather than the sheet of paper.
Dysphagia is a matter of life, not of comfort. Among patients with dysphagia, 32.1% develop pneumonia (95% CI 22.4–41.8) and mortality reaches 31.3% at one year (95% CI 25.6–36.9) 4. This is a speech and language therapy and medical domain, but the physiotherapist is often the professional who spends the most time with the patient: they are the one who sees the cough on a glass of water.
Fatigue is not a lack of motivation. Almost one survivor in two is affected 5. It must be built into session planning (dosing, breaks, distribution of effort), rather than read as resistance from the patient. The same goes for depression: 71% of post-stroke depressions begin within 3 months (95% CI 65–76), and among patients depressed early, 53% remain so 8. The physiotherapist, who sees the patient closely and over a long period, is on the front line to spot and refer.
For spasticity, the main risk factor identified is moderate to severe paresis (OR = 6.573; 95% CI 2.579–16.755), ahead of haemorrhagic stroke and sensory impairment 9. For shoulder pain, the reported predictors are age, female sex, increased tone, sensory impairment, left hemiparesis, haemorrhagic stroke, spatial neglect and a high NIHSS score 10. These are profiles that can be identified from the first weeks, and therefore targets for close monitoring.
The “plasticity window”: what the data do, and do not, allow us to say
This is where we have to be candid. The idea of a privileged time window for recovery is very widespread in rehabilitation. The human evidence available to support it is indirect and, on several points, contradictory. Here is what can genuinely be put forward.
Signals in favour of an effect of timing. For robot-assisted gait rehabilitation, it is the patients who are non-ambulatory at the start of the intervention, and those in the first three months after the stroke, who benefit from electromechanical training combined with physiotherapy; patients who already walk do not 11. For functional electrical stimulation of the upper limb, the benefit on activities of daily living becomes significant when it is started on average within 2 months (SMD 1.24; 95% CI 0.46 to 2.03; n = 32) and disappears if it begins more than a year afterwards (SMD −0.10; 95% CI −0.59 to 0.38; n = 35), but all these analyses are of very low GRADE quality, and the authors explicitly conclude that no firm conclusion is possible on the optimal therapeutic window 12.
A contrary signal, and a robust one. The Cochrane review on repetitive task-oriented training (33 trials, 1,853 participants) reports that the effects were modified neither by the type of intervention, nor by the dose of practice, nor by the time since stroke, in the upper limb as in the lower limb 13. If a narrow window governed everything, that effect of timing ought to appear.
And a reminder that had protocols revised: early ≠ intensive. The AVERT trial (2,104 patients, 56 stroke units, 5 countries) compared very early, frequent, high-dose mobilisation within 24 h with usual care. In the intervention group, 92% of patients were mobilised within 24 h versus 59% under usual care. A counter-intuitive result: fewer favourable outcomes at 3 months (modified Rankin Scale 0-2: 46% versus 50%; adjusted OR 0.73; 95% CI 0.59–0.90; p = 0.004), with no reduction in immobility complications 14.
The prespecified dose-response analysis of AVERT cleanly separates the two parameters: increasing the daily frequency of out-of-bed episodes improves outcome (OR 1.13; 95% CI 1.09–1.18; p < 0.001), whereas increasing the amount of minutes of mobilisation per day worsens it (OR 0.94; 95% CI 0.91–0.97; p < 0.001). After age and initial severity, the frequency of sessions was the most decisive variable 15. The message is therefore not “less rehabilitation”, nor “wait”: it is shorter and more frequent sessions in the acute phase.
An honest summary: the time since stroke seems to matter for some modalities (gait robot, perhaps FES), not for others (task-oriented practice), and a well-delimited human plasticity window is not established by the data above. Beware categorical claims in either direction.
The recovery trajectory: the 70% rule and the case against it
The famous “proportional recovery rule” comes from the seminal study by Prabhakaran et al. 16, conducted on 41 patients with ischaemic stroke, whose upper limb deficit was assessed with the Fugl-Meyer between 24 and 72 hours and then reassessed at 3 or 6 months. In the full sample, clinical variables explained only 47% of the variance in recovery. After excluding a subgroup of the initially most severely affected patients, who recovered very poorly (the “non-fitters”), the explained variance rose to 89% and recovery was well approximated by a relationship proportional to the initial deficit: recovery ≈ 0.70 × initial deficit. This is the origin of the “70%”. The authors themselves concluded that clinical variables predict motor recovery only moderately well 16.
This rule is today seriously challenged on methodological grounds, and it should not be presented as an established law. Bowman et al. 17 show that the strong negative correlation between initial score and change (final score minus initial score), which serves as the empirical proof of the rule, is confounded by two statistical artefacts: mathematical coupling (the initial score appears on both sides of the correlation) and compression towards the ceiling of the scale (the ceiling effect of the Fugl-Meyer). The authors stress that this bias is present for individual inference as well as for group inference, and conclude that new techniques are needed for analysing recovery after stroke which are not confounded in this way 17.
The average trajectory does not predict the patient in front of you.
What determines prognosis: PREP2 rather than the crystal ball
If the 70% rule does not hold as an individual prognostic tool, is there anything better? Yes, at least for the upper limb, and from the very first days. The PREP2 algorithm was developed from the data of 207 patients recruited within 3 days of stroke (103 women, i.e. 50%; median age 72 years, range 18–98 years), using classification and regression tree analysis. It combines, in sequence, 18 :
- a measure of upper limb impairment;
- age;
- the presence or absence of motor evoked potentials in the upper limb, recorded by transcranial magnetic stimulation (TMS);
- the lesion load on MRI or stroke severity assessed by the NIHSS score.
The algorithm produces correct predictions of upper limb function at 3 months for 75% of patients, and the TMS biomarker is needed for only a third of them 18. It is today the best-validated upper limb prognostic tool we have.
The practical value is direct: PREP2 makes it possible to calibrate rehabilitation goals, restoration versus compensation, instead of flying blind. It is worth keeping in mind, though, what that figure means: 75% correct predictions also means that one patient in four is misclassified. An algorithm guides a strategy; it does not replace repeated clinical reassessment.
Key points
- The challenge is a population-level one : 11.9 million new strokes and 93.8 million people living with the after-effects in 2021; 3rd leading cause of death, 4th leading cause of DALYs 1.
- Organisation counts as much as technique : management in a stroke unit reduces the risk of a poor outcome (OR 0.77; 95% CI 0.69–0.87) moderate evidence 2. The physiotherapist acts as one link in a coordinated team, not alone 3.
- The after-effects go well beyond the motor system : dysphagia ~47%, fatigue ~47%, neglect ~29%, depression 27%, spasticity ~25% (39.5% where there is paresis), shoulder pain 22–47%, falls up to 73% in the 1st year.
- Early ≠ intensive : AVERT showed that very early, high-dose mobilisation reduces the chances of a good result at 3 months (46% vs 50%; adjusted OR 0.73). The right setting: sessions that are shorter and more frequent (frequency OR 1.13; minutes/day OR 0.94) 15.
- The 70% rule is not a law : it rests on the exclusion of the most severe patients, and its empirical proof is confounded by mathematical coupling and a ceiling effect 17. Do not announce it to a patient as a prognosis.
- A prognostic tool does exist : PREP2 (impairment + age + TMS + MRI/NIHSS) correctly predicts upper limb function at 3 months in 75% of patients, with TMS needed in only a third 18.
- What we do not know : the human “plasticity window” is not delimited by solid evidence. Timing modulates the effect of some modalities (gait robot: benefit within the first 3 months and in non-ambulatory patients), but not of task-oriented practice, whose effects are modified neither by dose nor by timing 13.
📊 How do you assess and predict recovery?
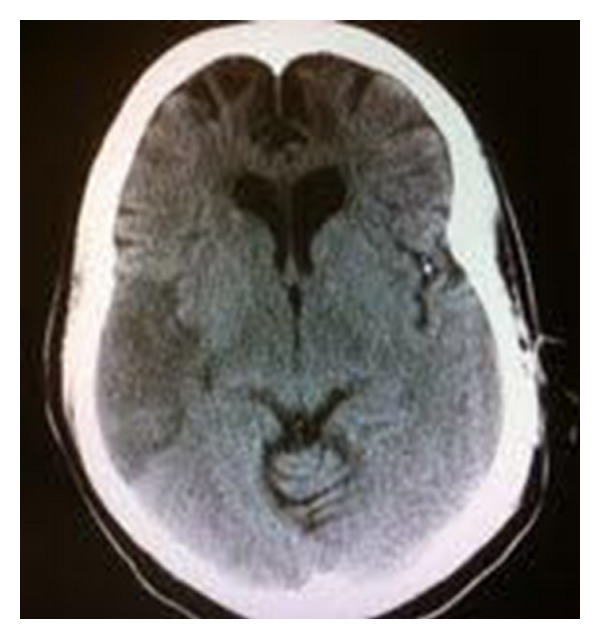
CT scanNon-contrast brain CT, axial slice: extensive right middle cerebral artery infarct, with loss of grey-white matter differentiation in the right hemisphere.
Source : Mehta et al., Case reports in neurological medicine, 2012, figure 3 · CC BY
“Will I walk again? Will I get my hand back?” The temptation is strong to answer from clinical experience or with a rule of thumb. This is precisely where the physiotherapist has to be rigorous: some prognostic tools are solid, others are statistical artefacts, and the boundary between the two is not intuitive.
The stakes go beyond the individual case: in 2021 there were 11.9 million new strokes worldwide and 93.8 million people living with the after-effects; stroke was the 3rd leading cause of death (7.3 million, 10.7% of all deaths) and the 4th leading cause of disability-adjusted life years (160.5 million DALYs) 1. Assessing properly means directing a scarce resource to where it changes something.
The initial assessment: mapping, not just measuring strength
The post-stroke assessment is not confined to the paretic limb. The AHA/ASA guidelines recall that rehabilitation requires a sustained and coordinated effort from a large team (the patient and their goals, family, carers, doctors, nurses, physiotherapists, occupational therapists, speech and language therapists, psychologists, social workers) and that without communication and coordination, isolated rehabilitation efforts are unlikely to reach their full potential 3. The physiotherapy assessment is therefore also a triage tool: it picks out what belongs to another link in the chain. Four domains have a prevalence that justifies systematic rather than opportunistic screening:
| To screen for | Documented frequency | Implication for the assessment |
|---|---|---|
| Dysphagia | 46.6% (95% CI 40.5–52.8); 58.8% after haemorrhagic stroke vs 43.6% if ischaemic. Among those with dysphagia: 32.1% pneumonia, 31.3% mortality at 1 year 4 | A matter of life; referral to speech and language therapy is not optional. |
| Unilateral spatial neglect | 29% (38% after a right-hemisphere lesion, 18% after a left-hemisphere lesion), across 41 studies and 6,324 participants 7 | Ecological assessments detect 53% of cases against 24% for tabletop tests. A normal pen-and-paper assessment does not rule out neglect. |
| Post-stroke fatigue | 46.79% (95% CI 43.41–50.18) across 66 studies and 11,697 patients; 53.19% in women, 57.54% after haemorrhagic stroke 5 | To be built into dosing (duration, breaks, distribution of effort), not to be read as a lack of motivation. |
| Depression | 27% (95% CI 25–30); cumulative incidence 38% at 1 year; 71% of episodes begin within the first 3 months 8 | The physiotherapist, who follows the patient closely and over a long period, is on the front line to spot and refer. |
Two motor complications can be tracked from the initial assessment, because their risk factors are known. Spasticity affects 25.3% of patients across all strokes and 26.7% after a first stroke; the incidence rises to 39.5% in patients with paresis, and 9.4% develop severe or disabling spasticity (MAS ≥ 3). The main risk factor is moderate to severe paresis (OR = 6.573; 95% CI 2.579–16.755), ahead of haemorrhagic stroke and sensory impairment 9. Hemiplegic shoulder pain has an incidence of 10 to 22% and a prevalence of 22 to 47%; its predictors are age, female sex, increased tone, sensory impairment, left hemiparesis, haemorrhagic stroke, spatial neglect and a high NIHSS score 10. In other words: the severe patient with sensory impairment and neglect is the profile to watch, and that is known from the very first assessment.
Finally, falls : reported incidence from 7% in the first week to 73% in the first year 6. Assessing balance and falls risk is not a refinement, it is a basic.
“Proportional recovery”: where the famous 70% comes from, and why to be wary of it
The proportional recovery rule was born from a study of 41 patients with ischaemic stroke, whose upper limb deficit was assessed with the Fugl-Meyer score (FM-UE) between 24 and 72 hours after the stroke, then reassessed at 3 or 6 months. In the full sample, clinical variables explained only 47% of the variance in recovery. After excluding a subgroup of the initially most severely affected patients, who recovered very poorly (the “non-fitters”), the explained variance rose to 89%, and recovery was well approximated by a relationship proportional to the initial deficit: recovery ≈ 0.70 × initial deficit. The authors themselves concluded that clinical variables predict motor recovery only moderately 16.
This rule has been taken up everywhere, often presented as a biological law of recovery. It is not one. Bowman et al. 17 show that the strong negative correlation between initial score and change (final score minus initial score), the empirical proof of the rule, is confounded by two statistical artefacts:
- Mathematical coupling : the initial score appears on both sides of the correlation (it is at once the predictor and a term of the calculated change). A negative correlation therefore appears even with no biological phenomenon at all.
- Compression towards the ceiling : the Fugl-Meyer has a ceiling effect; mildly affected patients cannot improve much on the scale, which mechanically compresses the data towards a proportional relationship.
The authors stress that this bias holds for individual inference as much as for group inference, and conclude that new techniques are needed for analysing recovery which are not confounded in this way 17.
Level of evidence: contested An honest position: the 70% rule is an interesting historical observation whose methodological validity is seriously called into question. It should serve neither to set a numerical target, nor to justify stopping the rehabilitation of a severe patient on the grounds that he would be a “non-fitter”.
The upper limb: PREP2, a prognosis from the first days
Where proportional recovery fails, a tool built for prediction holds up better. The PREP2 algorithm was developed on 207 patients recruited within 3 days of stroke (50% women; median age 72 years, range 18–98 years), by classification and regression tree 18. It combines sequentially four elements:
- a measure of upper limb impairment;
- age;
- the presence or absence of motor evoked potentials in the upper limb, recorded by transcranial magnetic stimulation (TMS);
- the lesion load obtained on MRI, or stroke severity assessed by the NIHSS score.
Level of evidence: moderate The algorithm produces correct predictions of upper limb function at 3 months for 75% of patients. A decisive practical point: the TMS biomarker is needed for only a third of patients: the sequential structure makes it possible to decide without TMS in the remaining two thirds 18.
What PREP2 changes concretely: it makes it possible to calibrate the goals (restoring function, or compensating and adapting the environment), instead of flying blind for weeks. But 75% correct predictions also means one patient in four misclassified. PREP2 guides a strategy, it does not close a door: an unfavourable prognosis excuses you neither from treating nor from reassessing.
The useful scales: which ones, and to say what
A scale is only worth something if you know at which level it measures: impairment, activity or participation. The tools that structure the team's shared language:
| Scale | What it measures | Where you meet it |
|---|---|---|
| Fugl-Meyer Upper Extremity (FM-UE) | Upper limb motor impairment | Tool of the seminal study on proportional recovery 16: beware its ceiling effect, called into question by 17. |
| NIHSS | Overall stroke severity | Component of PREP2, as an alternative to MRI 18 ; also a predictor of shoulder pain 10. |
| Modified Rankin Scale (mRS) | Overall disability; mRS 0–2 = “favourable” outcome | Primary outcome of AVERT 14. |
| Wolf Motor Function Test and Motor Activity Log | Arm motor performance (time to perform); amount and quality of real use in daily life | Outcomes of the EXCITE trial on constraint-induced therapy 19. The MAL captures use as reported in real life, not capacity in the clinic. |
| 6-minute walk test, walking speed, Timed Up and Go | Capacity, speed and functional mobility | Responsive to change: +60.86 m on the 6-minute test and +0.15 m/s after circuit training, two clinically significant effects 20. |
| Modified Ashworth Scale (MAS) | Tone / spasticity (threshold MAS ≥ 3 = severe spasticity) | Quantifies disabling spasticity, present in 9.4% of paretic patients 9. |
A cross-cutting principle, drawn from the assessment of neglect, applies to everything else: ecological measures and laboratory measures do not say the same thing (53% detection against 24%) 7. Capacity measured in the session is not performance at home.
What predicts independent walking: let us be honest about what we know
Level of evidence: uncertain It has to be said frankly: in the data cited here there is no equivalent of PREP2 for walking, that is, a validated algorithm, applicable from the first days, whose proportion of correct predictions is known. Predictors of walking independence are less well established than those for the upper limb, and to claim otherwise would be to over-interpret.
What the literature does allow us to state is who benefits from what: indirect but usable prognostic information. Gait training assisted by an electromechanical or robotic device, in combination with physiotherapy and not in its place, doubles the odds of becoming independent in walking again: OR 2.01 (95% CI 1.51 to 2.69; 38 studies, 1,567 participants; I² = 0%) high-quality evidence. The real message is in the subgroups: it is the patients who are non-ambulatory at the start of the intervention and those in the first three months who benefit: patients who already walk do not 11.
Initial walking status and time since stroke therefore genuinely shape the decision, without constituting a prognostic score. Three further landmarks:
- Walking is an outcome that moves. Repetitive task-oriented training improves walking distance (+34.80 m; 95% CI 18.19 to 51.41; 9 studies, 610 participants) moderate quality and functional ambulation (SMD 0.35; 95% CI 0.04 to 0.66); benefits maintained up to six months, not beyond 13.
- Physical fitness conditions independence. Cardiorespiratory training reduces disability (SMD 0.52; 95% CI 0.19 to 0.84; 8 studies, 462 participants) moderate certainty and increases peak VO₂ by 3.40 mL/kg/min, with no serious adverse event across 75 trials 21. Assessing exercise capacity is therefore part of the walking assessment.
- The place of care weighs on the prognosis. The organised stroke unit reduces the risk of a poor outcome by about 23% (OR 0.77; 95% CI 0.69 to 0.87; 29 trials, 5,902 participants) 2.
Key points
- The initial assessment is a triage, not a catalogue. Dysphagia (46.6%), neglect (29%), fatigue (46.8%), depression (27%) are too frequent to be looked for only “if it occurs to you”. A normal tabletop test does not rule out neglect: ecological assessments find twice as many 7.
- The 70% rule is not a law. Born on 41 patients and only after excluding the most severe subjects 16, it is confounded by mathematical coupling and by the ceiling effect of the Fugl-Meyer 17. Do not announce it as a prognosis.
- PREP2 is the best-validated tool for the upper limb : impairment + age + motor evoked potentials (TMS) + MRI or NIHSS, from the first 3 days; 75% correct predictions at 3 months, TMS needed in only a third of patients 18. It serves to choose between restoration and compensation, not to give up.
- For walking, own the uncertainty : no equivalent validated algorithm. Two variables nevertheless guide the decision: being non-ambulatory at inclusion, being within the first three months: these profiles benefit from robot-assisted training combined with physiotherapy (OR 2.01), unlike patients who already walk 11.
- Reassess. A prognosis is a dated working hypothesis, not a sentence.
⏱️ What dose of rehabilitation? The crux of the matter
🔢 How many repetitions in a real session? Far fewer than you think
Timing of 312 real physiotherapy and occupational therapy sessions. The gap with the doses tested in research is dizzying.
Practice of functional upper limb movement occurred in only 51% of the sessions that targeted it (32 repetitions on average, 95% CI 20–44); walking was practised in 84% of sessions. Source: Lang et al., 2009 (PMID 19801058).
⚠️ Earlier and harder is not better: the result that changed the protocols
Mobilising very early, very often and at a high dose within 24 hours produced FEWER good results than usual care.
2,104 patients, 56 stroke units, 5 countries. Adjusted odds ratio 0.73 (95% CI 0.59–0.90; p = 0.004), with no reduction in immobility complications. Source: AVERT trial, The Lancet 2015 (PMID 25892679).
It is the question that comes back at every assessment, every prescription renewal, every discussion with the family: how much? How many sessions, how many minutes, how many repetitions, from when. And it is precisely the question on which the literature is most uncomfortable, because it does not answer “more is better”, but something far more nuanced.
The landmark AHA/ASA guidelines for adult rehabilitation after stroke are nonetheless explicit about what is at stake: the provision of comprehensive rehabilitation programmes, with resources, adequate dose and duration, is an essential aspect of stroke care and must be a priority 3. The problem is that “adequate” is never given a number there, and for good reason.
What is actually delivered: the starting point is low
Before discussing the optimal dose, we have to look at the real dose. The seminal observational study on the subject timed 312 post-stroke physiotherapy and occupational therapy sessions 22. The figures are soberly damning:
- the practice of functional upper limb movements occurred in only 51% of sessions that were nevertheless targeting the upper limb;
- when it did occur, the average was 32 repetitions per session (95% CI 20-44);
- for the lower limb, walking was practised in 84% of sessions, with an average of 357 steps per session (95% CI 296-418).
The authors conclude that this dose is low set against animal models of plasticity. Thirty-two repetitions: that is the order of magnitude of what a healthy person does picking up their mug and their phone between two meetings. One session in two targeting the arm contains no functional practice of that arm at all.
This finding is the foundation of everything that follows. It explains why so many intervention trials are in fact comparing “little” with “slightly less little”. And it raises an immediate practical question, independent of any scientific controversy: how many repetitions do you yourself count in your sessions? No one can optimise a dose they do not measure.
Adding rehabilitation: yes, but the supplement has to be massive
Since the baseline dose is low, would it be enough simply to add more? Partly, and at a high price. The meta-analysis by Schneider 23 pooled the trials that added rehabilitation to usual care, with activity limitation as the target:
- moderate overall effect: SMD 0.39 (95% CI 0.07 to 0.71);
- restricting to the studies adding more than 100% of additional therapy, the effect strengthens: SMD 0.59 (95% CI 0.23 to 0.94);
- ROC analysis places the useful threshold at at least +240% of rehabilitation for a significant probability of improving activity.
Clinical translation: +240% is not “one more session a week”. It is more than tripling the volume. The authors indeed conclude bluntly that the amount of additional rehabilitation needed to obtain a beneficial effect is large. On this basis, adding ten minutes to a thirty-minute session has no reason to change a patient's functional outcome. It is an unwelcome but useful piece of information: it guards against false hopes, and it refocuses the discussion on how the care pathway is organised (self-directed practice, family and friends, structuring the day) rather than on face-to-face time alone.
Repeating more: the experiment that failed
If the dose of repetitions is low and if adding volume works (at a high dose), then multiplying the repetitions ought to work. A phase II randomised trial tested this hypothesis head-on 24 : 85 adults with upper limb paresis more than 6 months after a stroke, randomised into 4 dose groups (3,200, 6,400, 9,600 repetitions, or an individualised maximum), in one-hour sessions, 4 days a week for 8 weeks.
Result: no dose-response effect was demonstrated on functional capacity, and treatment effects were small overall. Tripling the repetitions changed nothing.
Going from 3,200 to 9,600 repetitions in the chronic phase produced no additional functional gain 24. Dose alone is not the lever.
This result converges with a too-rarely-cited point from the Cochrane review by French 13 on repetitive task-oriented training (33 trials, 1,853 participants): the effects were modified neither by the type of intervention, nor by the dose of practice, nor by the time since stroke, whether in the upper or the lower limb. This training works: arm function SMD 0.25 (95% CI 0.01 to 0.49; 11 studies, 749 participants), hand function SMD 0.25 (95% CI 0.00 to 0.51; 8 studies, 619 participants), walking distance +34.80 m (95% CI 18.19 to 51.41; 9 studies, 610 participants), functional ambulation SMD 0.35 (95% CI 0.04 to 0.66), with benefits maintained up to 6 months after treatment but not beyond, but it does not work in proportion to the dose within the range studied.
Let us say it plainly: the literature is here in tension with itself. Schneider 23 suggests that a massive supplement of rehabilitation improves activity; Lang 24 shows that a massive supplement of repetitions improves nothing in the chronic phase; French 13 finds no moderating effect of dose. These results are not strictly contradictory (they measure neither the same thing, nor at the same phases, nor with the same session content), but no honest physiotherapist can today announce a target number of repetitions founded on solid evidence. The optimal dose threshold remains unknown.
Starting early: the AVERT turning point
That leaves timing. “As early as possible” was long a consensus slogan. AVERT shattered it.
The AVERT phase III trial 14 is the largest randomised trial of very early mobilisation: 2,104 patients (ischaemic or haemorrhagic stroke, first or recurrent), 56 stroke units, 5 countries, randomised between very early, high-dose mobilisation within 24 h (n = 1,054) and usual care (n = 1,050). The protocol was applied: 965 patients (92%) mobilised within 24 h in the intervention group versus 623 (59%) under usual care.
| Outcome at 3 months | Very early mobilisation (n = 1,054) | Usual care (n = 1,050) |
|---|---|---|
| Favourable outcome (mRS 0-2) | 480 patients (46 %) | 525 patients (50 %) |
| Adjusted odds ratio | 0.73 (95% CI 0.59-0.90; p = 0.004), against very early mobilisation | |
| Immobility complications | No reduction | |
The protocol of very early, high-dose mobilisation was associated with a reduction in the chances of a favourable outcome at 3 months. A trial of this size, multicentre, with a result running against the prevailing intuition: this is the kind of result that gets protocols revised, and that is what happened.
The decisive nuance: frequency ≠ amount
Reading AVERT as “mobilise later” or “do less rehabilitation” is a misreading. The prespecified dose-response analysis of AVERT 15 separates the two components of dose, controlling for age and stroke severity:
- increasing the daily frequency of out-of-bed sessions increases the chances of a good result: OR 1.13 (95% CI 1.09 to 1.18; p < 0.001) ;
- increasing the amount of minutes of mobilisation per day reduces them : OR 0.94 (95% CI 0.91 to 0.97; p < 0.001).
After age and initial severity, the frequency of sessions is the most decisive variable. The message is therefore not “less rehabilitation” but shorter and more frequent sessions in the acute phase. What did harm in AVERT was not having started early: it was the volume per session imposed too early.
Key points: dose in practice
- Measure before you optimise. The dose actually delivered is low: 32 upper limb repetitions per session, and only in 51% of the sessions that target it; 357 steps per session for the lower limb 22.
- A small supplement is not enough. The effect of added rehabilitation strengthens beyond +100% of therapy (SMD 0.59) and the useful ROC threshold sits at +240 % 23. A few extra minutes do not change the functional outcome.
- But piling up repetitions does not work either. In the chronic phase, 3,200 vs 6,400 vs 9,600 repetitions: no dose-response effect 24. The effects of task-oriented training are modified neither by dose nor by the time since stroke 13.
- Earlier and more intense is not better. AVERT: mRS 0-2 in 46% vs 50%, adjusted OR 0.73 (95% CI 0.59-0.90; p = 0.004), with no reduction in immobility complications 14.
- In the acute phase: short and often. Frequency of out-of-bed episodes OR 1.13; minutes per day OR 0.94 15. Dose it; do not settle for starting early.
- The optimal number of repetitions remains unknown. Do not present it to the patient or to the team as an established fact.
What improves disability, when dose alone fails
If the raw amount of practice is not the expected lever, is anything? Yes, and it is the most instructive contrast in the literature. The Cochrane review by Saunders 21, on 75 trials and 3,017 participants who were mostly ambulatory, shows that cardiorespiratory training reduces disability at the end of the intervention: SMD 0.52 (95% CI 0.19 to 0.84; 8 studies, 462 participants; p = 0.002; moderate certainty), with an increase in peak VO2 of 3.40 mL/kg/min (95% CI 2.98 to 3.83). Mixed training also reduces disability, more modestly: SMD 0.23 (95% CI 0.03 to 0.42; low certainty).
In other words: where tripling the repetitions does not move the needle 24, working on cardiorespiratory fitness reduces disability with a moderate level of evidence. The benefit would come through improved mobility and balance. On safety, the review is reassuring: no deaths were influenced by any intervention (all risk differences 0.00) and no evidence of any serious adverse event. The authors conclude that there is enough evidence to incorporate cardiorespiratory and mixed training, including walking, into post-stroke rehabilitation programmes.
This is not an invitation to abandon task-oriented practice: it has its own evidence, notably +34.80 m of walking distance 13. It is an invitation not to reduce the question of dose to a repetition counter: the nature of the load counts as much as its volume.
The gap between guidelines and practice
That leaves the gulf. On one side, the AHA/ASA guidelines state that comprehensive programmes, with resources and adequate dose and duration, are an essential aspect of care and must be a priority, and warn explicitly against budget cuts in rehabilitation 3. On the other, the dose actually observed in the field remains low set against models of plasticity 22, and the supplement needed to change activity is of the order of +240% 23.
No physiotherapist bridges a gap like that alone. The guidelines say so head-on: post-stroke rehabilitation requires a sustained and coordinated effort from a large team (the patient and their goals, family, carers, doctors, nurses, physiotherapists, occupational therapists, speech and language therapists, psychologists, dietitians, social workers) and without communication and coordination, isolated efforts are unlikely to reach their full potential 3. Dose is not only a session variable: it is a variable of organisation, structure and resources.
What does depend on the practitioner, on the other hand, is very real: counting what they deliver, favouring frequency over duration in the acute phase, not confusing “starting early” with “loading heavily”, incorporating fitness training, and telling the patient and their family honestly that the optimal dose is not known, rather than selling them a figure that does not exist.
💪 How do you rehabilitate the upper limb?
🎯 What upper limb techniques are really worth
They all “work”, but the effect sizes are modest and comparable. None is the miracle cure that its promotion sometimes suggests.
Standardised mean differences (Cochrane reviews). Interpretation guide: 0.2 = small effect, 0.5 = medium effect. Mirror: Thieme 2018 (PMID 29993119, 36 studies); CIMT: Corbetta 2015 (PMID 26446577, 28 studies); robotics: Mehrholz 2018 (PMID 30175845, 41 studies); virtual reality added to usual care: Laver 2025 (PMID 40537150, 190 studies).
The upper limb is the area where post-stroke rehabilitation is most disputed: it is where techniques have multiplied (constraint-induced therapy, mirror, robots, electrical stimulation, virtual reality), and it is also where effect sizes are most modest. The largest Cochrane review on physical rehabilitation after stroke (267 trials, 21,838 participants, 36 countries) confirms that rehabilitating improves recovery of function and mobility: independence in activities of daily living SMD 1.32; 95% CI 1.08 to 1.56 (low-certainty evidence), motor function SMD 1.01 (95% CI 0.80 to 1.22), but it does so by combining several treatment components, not by applying a miracle method 25. None of the techniques below escapes this rule: they are to be read as ingredients, never as self-sufficient protocols.
Before choosing a technique: knowing what this arm can become again
Deciding between aiming for restoration (recovering a movement) and organising compensation (doing it another way) is the first clinical decision, and it is taken early. The PREP2 algorithm 18, developed on 207 patients recruited within 3 days of stroke (median age 72 years, 18-98 years), sequentially combines a measure of upper limb impairment, age, the presence or absence of motor evoked potentials recorded by transcranial magnetic stimulation (TMS), then MRI lesion load or the NIHSS score. It correctly predicts upper limb function at 3 months in 75% of patients, the TMS biomarker being needed for only a third of them. It is today the best-validated upper limb prognostic tool.
Conversely, the famous “70% rule” must be handled with great caution. It comes from the seminal study by Prabhakaran 16, conducted on 41 ischaemic patients assessed with the Fugl-Meyer between 24 and 72 h then at 3 or 6 months: in the full sample, clinical variables explained only 47% of the variance in recovery; it was only after excluding the most severely affected patients, who recovered very poorly (the “non-fitters”), that the explained variance rose to 89%, with recovery ≈ 0.70 × initial deficit. The authors themselves concluded that clinical variables predict motor recovery only moderately.
Above all, Bowman 17 shows that the strong negative correlation between initial score and change, which serves as the empirical proof of this rule, is confounded by two statistical artefacts : mathematical coupling (the initial score appears on both sides of the correlation) and compression towards the ceiling of the Fugl-Meyer scale. This bias holds for individual inference as much as for group inference, and the authors call for new techniques for analysing recovery.
The average trajectory of a cohort does not predict the patient in front of you. Announcing “you will recover 70%” is not a piece of data: it is a contested extrapolation.
Constraint-induced movement therapy (CIMT): motor function yes, disability uncertain
CIMT rests on forced use and massed practice of the affected arm, by constraining the unaffected arm. The seminal EXCITE trial 19 (222 patients, 3 to 9 months after stroke, 7 US academic centres), tested two weeks of wearing a mitt on the unaffected hand combined with repeated task practice. At 12 months: a 52% reduction in performance time on the Wolf Motor Function Test against 26% under usual care (between-group difference 34%, p < 0.001), a gain of 0.43 points on the Motor Activity Log “amount of use” (p < 0.001) and of 0.48 points on “quality of movement” (p < 0.001).
The synthesis is more sober. The Cochrane review by Corbetta 26, which brings together 42 trials and 1,453 participants, finds on the most frequently reported outcome, arm motor function (28 studies, 858 participants), a significant but modest effect: SMD 0.34; 95% CI 0.12 to 0.55; p = 0.004. But on the primary outcome, disability, the effect at the end of the intervention is not significant (SMD 0.24; 95% CI −0.05 to 0.52; 11 trials, 344 participants), and a few months later, three studies (125 participants) find no difference: SMD −0.20; 95% CI −0.57 to 0.16, numerically in favour of conventional treatment. The authors' conclusion: CIMT is associated with limited improvements in impairment and motor function, but these benefits did not convincingly reduce disability.
What that means concretely, and what has to be said to the patient: the arm moves better on the tests, without solid evidence that daily life is lastingly transformed by it.
Repetitive task-oriented training: the foundation, with a small effect
Repeating concrete functional tasks rather than analytical movements is the backbone of modern rehabilitation. The Cochrane review by French 13, 33 trials and 1,853 participants, finds a real but small benefit: arm function SMD 0.25 (95% CI 0.01 to 0.49; 11 studies, 749 participants) and hand function SMD 0.25 (95% CI 0.00 to 0.51; 8 studies, 619 participants), on low-quality evidence. The improvements are maintained up to six months after the end of treatment, but not beyond.
Two findings that unsettle the usual “more repetitions = more recovery” reasoning:
- The effects were modified neither by the type of intervention, nor by the dose of task practice, nor by the time since stroke 13. The superiority of one “concept” over another is not demonstrated in these data.
- The phase II trial by Lang 24 tested dose head-on in the chronic phase: 85 adults with upper limb paresis more than 6 months on, randomised into 4 groups (3,200, 6,400, 9,600 repetitions, or an individualised maximum), one-hour sessions, 4 days a week, 8 weeks. Result: no dose-response effect on functional capacity, and treatment effects small overall. Tripling the repetitions in the chronic phase is not enough.
This finding coexists with the opposite problem in practice: the dose actually delivered is very low. The observational study by Lang 22, which timed 312 post-stroke physiotherapy and occupational therapy sessions, shows that practice of functional upper limb movement occurred in only 51% of the sessions targeting the upper limb, with an average of 32 repetitions per session (95% CI 20-44): a low dose set against animal models of plasticity. And when usual rehabilitation is increased, the effect on activities is moderate (SMD 0.39; 95% CI 0.07 to 0.71) and only strengthens beyond +100% of therapy (SMD 0.59; 95% CI 0.23 to 0.94), the analysis placing the useful threshold at at least +240% of rehabilitation 23. In other words: a few extra minutes per session change nothing; it is orders of magnitude that count, and the literature does not yet say how to reach them.
Mirror therapy: inexpensive, moderate-quality evidence
It is probably the best evidence-to-cost ratio for the upper limb. The Cochrane review by Thieme 27, 62 studies and 1,982 participants, finds moderate-quality evidence of a significant positive effect on motor function (SMD 0.47; 95% CI 0.27 to 0.67; 1,173 participants, 36 studies) and on motor impairment (SMD 0.49; 95% CI 0.32 to 0.66; 1,292 participants, 39 studies), compared with all other interventions. Mirror therapy may also improve activities of daily living (SMD 0.48; 95% CI 0.30 to 0.65; 622 participants, 19 studies). The authors conclude that mirror therapy is effective “at least as an adjunct” to conventional rehabilitation: the wording matters: adjunct, not substitute.
Upper limb robotics: high-quality evidence, small effects
The Cochrane review by Mehrholz 28, 45 trials and 1,619 participants, is one of the rare bodies of evidence rated high quality in rehabilitation. Arm training assisted by an electromechanical or robotic device improves activities of daily living (SMD 0.31; 95% CI 0.09 to 0.52; 24 studies, 957 participants), arm function (SMD 0.32; 95% CI 0.18 to 0.46; p < 0.0001; 41 studies, 1,452 participants) and muscle strength (SMD 0.46; 95% CI 0.16 to 0.77; 23 studies, 826 participants): high-quality evidence. Safety is good: no increase in the risk of dropout (RD 0.00; 95% CI −0.02 to 0.02).
The nuance not to lose: high-quality evidence does not mean a large effect. SMDs of 0.31-0.32 remain small effects: the certainty concerns the existence of the benefit, not its size.
Functional electrical stimulation (FES): an early signal, very low-quality evidence
This is where uncertainty is greatest, and it has to be said frankly. The review by Eraifej 12, on 20 studies, finds no significant overall benefit of FES on activities of daily living (SMD 0.64; 95% CI −0.02 to 1.30; 6 studies, n = 67 in the FES group). A signal appears according to timing: when FES is started on average within 2 months of the stroke, the benefit on ADL becomes significant (SMD 1.24; 95% CI 0.46 to 2.03; n = 32); started more than a year afterwards, it no longer brings anything (SMD −0.10; 95% CI −0.59 to 0.38; n = 35). But all these analyses are of very low GRADE quality (heterogeneity, very small samples, absence of blinding), and the authors explicitly conclude that no firm conclusion can be drawn either on the efficacy of FES or on its optimal therapeutic window. Treating “do it early” as an established recommendation would be an over-interpretation.
Virtual reality: an add-on, not a substitute
The 2025 Cochrane update 29 covers 190 studies and 7,188 participants. Compared with an alternative therapy, virtual reality brings only a slight gain in upper limb function: SMD 0.20; 95% CI 0.12 to 0.28; 67 studies, 2,830 participants; low-certainty evidence. By contrast, added to usual care, it probably improves upper limb function more clearly: SMD 0.42; 95% CI 0.26 to 0.58; 21 studies, 689 participants; moderate certainty. Fifty-nine studies monitored adverse effects, with few mild events reported. The reading is clear: VR is worth having as an attractive additional dose alongside rehabilitation, not as a replacement for it.
Summary table
| Technique | Main effect (upper limb) | Level of evidence | Key point |
|---|---|---|---|
| Constraint-induced therapy (CIMT) | Arm motor function SMD 0.34 (0.12-0.55): disability SMD 0.24 (−0.05 to 0.52), non-significant 26 | Moderate for motor function | Improves motor function, without convincing reduction in disability |
| Repetitive task-oriented training | Arm SMD 0.25 (0.01-0.49); hand SMD 0.25 (0.00-0.51) 13 | Low | Small but consistent effect, maintained 6 months; not modified by dose or timing |
| Mirror therapy | Motor function SMD 0.47 (0.27-0.67); ADL SMD 0.48 (0.30-0.65) 27 | Moderate | Effective at least as an adjunct; almost no cost |
| Arm robotics | ADL SMD 0.31; function SMD 0.32; strength SMD 0.46 28 | High | Benefit certain but small; safe (no excess dropouts) |
| Functional electrical stimulation | ADL overall non-significant SMD 0.64 (−0.02 to 1.30); < 2 months SMD 1.24 12 | Very low (GRADE) | No firm conclusion possible, including on the early window |
| Virtual reality | vs alternative therapy SMD 0.20; added to usual care SMD 0.42 29 | Moderate as an add-on / low as a substitute | Useful add-on, poor substitute; adverse effects rare and mild |
What remains frankly uncertain
- Transfer to daily life. Almost all these techniques shift motor function scores; very few demonstrate a reduction in disability. That is the central hole in the upper limb literature 26.
- Dose. We know that the delivered dose is low 22, that increasing it usefully requires massive supplements 23, and yet tripling the repetitions in the chronic phase produced no dose-response effect 24, and dose did not modify the effects of task-oriented training 13. These results do not reconcile as yet: the dose-effect relationship for the upper limb remains unresolved.
- The time window. The only large trial of early dosing available, AVERT (2,104 patients, 56 stroke units, 5 countries), concerns overall mobilisation and not the arm, but its message serves as a warning: very early, high-dose mobilisation within 24 h reduced the chances of a favourable outcome at 3 months (mRS 0-2: 46% against 50%; adjusted OR 0.73; 95% CI 0.59-0.90; p = 0.004). Earlier and harder is not automatically better.
- The individual patient. Group prognosis 18 is more robust than any extrapolation drawn from the “70% rule”, whose statistical foundations are contested 17.
Key points
- Set the prognosis early. PREP2 18 correctly predicts upper limb function at 3 months in 75% of patients from the first days: a support for deciding between restoration and compensation. The “70% rule” is not a law: it is confounded by mathematical coupling and by a ceiling effect 17.
- No technique is a treatment on its own. The effects are small and look alike: SMD ≈ 0.25 for task-oriented training 13, 0.32-0.34 for robotics and CIMT 2826, 0.47-0.49 for mirror therapy 27, 0.20 to 0.42 for virtual reality depending on whether it replaces or supplements 29.
- The best evidence-to-cost ratio is mirror therapy (moderate-quality evidence); robotics has the most solid evidence but small effects; upper limb FES rests on very low-quality evidence and permits no firm conclusion 12.
- Tell the patient the truth about CIMT: the arm moves better (SMD 0.34), but a reduction in disability is not demonstrated 26.
- Rehabilitation remains teamwork. The AHA/ASA guidelines 3 recall that it requires a sustained and coordinated effort from a large team including the patient and their goals, their family, doctors, nurses, physiotherapists, occupational therapists and speech and language therapists, and that comprehensive programmes, with resources and adequate dose and duration, are an essential aspect of stroke care, which must be a priority.
🚶 How do you rehabilitate walking and balance?
🩹 Falls: up to 3 patients in 4 in the first year
It is one of the most frequent complications, and therapeutic exercise brings only a partial answer, which has to be stated honestly.
Reported incidence of falls after stroke. Therapeutic exercise reduces the RATE of falls by about 28% (rate ratio 0.72; 95% CI 0.54–0.94; 765 participants; low-quality evidence) but does NOT reduce the number of people who fall at least once. Source: Denissen et al., Cochrane review 2019 (PMID 31573069).
🚶 Circuit training: the best evidence-to-feasibility ratio
A group form of task-oriented training (therefore feasible in a practice or a centre, with several patients at once), with a clinically significant gain.
10 studies (835 participants) for distance, 8 studies (744 participants) for speed; moderate level of evidence for both. The scale of the second bar chart is in hundredths of m/s. Source: English et al., Cochrane review 2017 (PMID 28573757).
Walking again is almost always the number one goal expressed by the patient and their family. It is also the domain in which post-stroke physiotherapy has its most solid data: provided you know what each tool actually does, and for whom. On a global scale the stakes are considerable: in 2021 there were 11.9 million new strokes and 93.8 million people living with the after-effects, stroke being the 4th leading cause of disability-adjusted life years (160.5 million DALYs, 5.6% of the total) 1.
First piece of good news, and it is not trivial: physical rehabilitation works. The largest Cochrane review on the subject (267 trials, 21,838 participants, 36 countries) concludes that physical rehabilitation, combining several treatment components, probably improves recovery of function and mobility after a stroke. Compared with no rehabilitation, it improves independence in activities of daily living (SMD 1.32; 95% CI 1.08 to 1.56), motor function (SMD 1.01; 95% CI 0.80 to 1.22) and walking speed (SMD 0.23; 95% CI 0.05 to 0.42) 25. The debate is therefore no longer “should we rehabilitate?” but “with what, at what dose, and in whom?”.
Task-oriented training: the foundation of walking rehabilitation
The principle is simple and demanding: have the patient practise the task itself, actively and repeatedly, rather than analytical movements supposed to prepare for it. For walking, this is the best-established pillar.
The landmark Cochrane review (33 trials, 1,853 participants) finds, with a moderate level of evidence, a gain of +34.80 metres of walking distance (95% CI 18.19 to 51.41; 9 studies, 610 participants) and an improvement in functional ambulation (SMD 0.35; 95% CI 0.04 to 0.66; 8 studies, 525 participants). Functional lower limb measures also improve (SMD 0.29; 95% CI 0.10 to 0.48). The benefits are maintained up to six months after the end of treatment, but not beyond 13. By way of comparison, the effect on the upper limb is markedly smaller and of low quality (arm function: SMD 0.25; 95% CI 0.01 to 0.49): it is indeed on walking that this approach gives the best return.
One result deserves emphasis, because it unsettles habits: in this review, the effects were modified neither by the type of intervention, nor by the dose of practice, nor by the time since stroke 13. In other words, no particular “method” stands out, and it is never too late to start.
Its group version, circuit training (circuit class therapy), produces clinically significant gains: +60.86 m on the 6-minute walk test (95% CI 44.55 to 77.17; 10 studies, 835 participants; moderate evidence), +0.15 m/s of walking speed (95% CI 0.10 to 0.19; 8 studies, 744 participants; moderate evidence) and -3.62 s on the Timed Up and Go (5 studies, 488 participants). An honest reservation to put to the patient: an excess risk of falls during sessions cannot be ruled out (risk difference 0.03; 95% CI -0.02 to 0.08; very low-quality evidence) and calls for monitoring 20.
Dose: the real Achilles heel of rehabilitation
What is delivered in practice falls far short of what plasticity demands. The seminal observational study timed 312 post-stroke physiotherapy and occupational therapy sessions: walking was practised in 84% of the sessions targeting the lower limb, with an average of 357 steps per session (95% CI 296-418): a dose the authors describe as low set against animal models of plasticity 22.
Increasing the dose helps, but the supplement needed is massive: the overall effect of additional rehabilitation on activities is moderate (SMD 0.39; 95% CI 0.07 to 0.71), strengthens when the supplement exceeds 100% (SMD 0.59; 95% CI 0.23 to 0.94), and the analysis places the useful threshold at at least +240% of rehabilitation 23. A few extra minutes per session will not change the functional outcome.
Take care, though, not to turn “more” into dogma. In the acute phase, the AVERT trial (2,104 patients, 56 stroke units, 5 countries) showed that very early, high-dose mobilisation within 24 h reduces the chances of a favourable outcome at 3 months (modified Rankin Scale 0-2: 46% vs 50%; adjusted OR 0.73; 95% CI 0.59 to 0.90; p = 0.004) 14. The prespecified dose-response analysis separates the two ingredients: increasing the daily frequency of out-of-bed episodes improves outcome (OR 1.13; 95% CI 1.09 to 1.18; p < 0.001), whereas increasing the number of minutes of mobilisation per day worsens it (OR 0.94; 95% CI 0.91 to 0.97; p < 0.001) 15. In the acute phase: shorter and more frequent sessions.
Key points on dose
- The dose actually delivered is low: ~357 steps per session on average 22.
- To change activities, a considerable supplement is needed, of the order of +240% 23.
- In the acute phase, what harms is not the early start but the volume per session: shorter, more often 14.
- For task-oriented training, no modulation of the effect by dose or by time since stroke has been demonstrated 13 : these data are contradictory, and the “right dose” remains an open question to own in front of the patient.
Treadmill and body-weight support: what can, and cannot, be stated
The treadmill with body-weight support is widely used in non-ambulatory patients: it allows walking to be practised before independent standing is possible. In evidential terms, it belongs to the family of electromechanical gait-assistance devices, whose results are detailed below.
Let us be explicit about the limit: the data used here settle neither the question of the treadmill with body-weight support compared with the treadmill without it, nor the optimal percentage of unloading, nor the starting speed. These parameters are today a matter of clinical reasoning and patient tolerance, not of a validated figure. The transferable principle, however, is supported: it is by walking that one relearns to walk 1325, and training that includes walking is among the recommended components 21.
Gait robotics: highly effective… for one precise subgroup
This is probably the most actionable message in this whole section. The Cochrane review (62 trials, 2,440 participants) shows that gait training assisted by an electromechanical or robotic device, in association with physiotherapy and not in its place, doubles the odds of becoming independent in walking again: OR 2.01 (95% CI 1.51 to 2.69; 38 studies, 1,567 participants; p < 0.00001; I² = 0%; high-quality evidence) 11.
But the effects on gait parameters are far more modest: +0.06 m/s of speed (95% CI 0.02 to 0.10; 42 studies, 1,600 participants; low quality) and no gain in walking distance (+10.9 m on the 6-minute test; 95% CI -5.7 to 27.4; p = 0.2). Above all, the benefit is targeted: it is patients who are non-ambulatory at the start of the intervention and those in the first three months after the stroke who gain from it; patients who already walk do not 11.
For prescribing, this gives a clear rule: the robot is not a high-end gadget for independent patients you want to make faster, it is a tool for having those who cannot yet practise walking on their own practise it.
| Intervention | Main effect on walking | Level of evidence | In whom |
|---|---|---|---|
| Repetitive task-oriented training 13 | +34.80 m of walking distance | Moderate | Effect not modified by the time since stroke |
| Circuit training 20 | +60.86 m on the 6 min; +0.15 m/s | Moderate | Ambulatory patients, in a group; monitor falls |
| Robot / electromechanical + physiotherapy 11 | ×2 odds of independent walking (OR 2.01) | High | Non-ambulatory, < 3 months post-stroke |
| Cardiorespiratory training 21 | Reduces disability (SMD 0.52); peak VO₂ +3.40 mL/kg/min | Moderate | Mostly ambulatory patients |
| Virtual reality as an add-on 29 | Slight gain (function, balance, activity limitation) | Low to moderate | As an add-on to usual care, not as a substitute |
Balance: a gain that often comes from elsewhere
Balance does not have to be worked on exclusively for its own sake. The Cochrane review on physical fitness after stroke (75 trials, 3,017 participants) reports multiple benefits of training on fitness (peak VO₂, strength), mobility (walking speed) and physical function, including balance ; the authors even suggest that the observed reduction in disability could be mediated by the improvement in mobility and balance 21. Circuit training, for its part, improves the Timed Up and Go by 3.62 s (5 studies, 488 participants) 20.
As for virtual reality and interactive video games, the 2025 Cochrane update (190 studies, 7,188 participants) concludes that there is moderate- to low-certainty evidence of a benefit slightly greater than alternative approaches on upper limb function, balance and activity limitation; as an add-on to usual care, the effect on upper limb function becomes clearer (SMD 0.42; 95% CI 0.26 to 0.58; moderate certainty). The adverse effects reported are rare and mild 29. To be positioned as a motivating add-on, not as a substitute.
Falls prevention: temper the message
Falls are one of the most frequent complications after a stroke, with a reported incidence ranging from 7% in the first week to 73% in the first year 6. The temptation is strong to promise that “rehabilitation prevents falls”. The data call for more caution.
Therapeutic exercise may reduce the rate of falls (rate ratio 0.72; 95% CI 0.54 to 0.94; 765 participants), i.e. about -28%, but this evidence is of low quality and the authors themselves say they are uncertain about this result. By contrast, exercise does not reduce the number of people who fall at least once (risk ratio 1.03; 95% CI 0.90 to 1.19; 969 participants; very low-quality evidence) 6.
An honest wording to use with the patient: exercise seems above all to reduce the repetition of falls in those who fall, without guaranteeing that it prevents falling, and the level of evidence remains low.
Cardiorespiratory fitness: the most under-used lever
It is one of the best-supported physiotherapy interventions after stroke, and probably the most neglected. Across 75 trials and 3,017 participants (mostly ambulatory), divided into cardiorespiratory training (32 studies), strengthening (20 studies) and mixed training (23 studies) 21 :
- SMD 0.52: cardiorespiratory training reduces disability (95% CI 0.19 to 0.84; 8 studies, 462 participants; p = 0.002; moderate certainty).
- SMD 0.23: mixed training also reduces disability (95% CI 0.03 to 0.42; low certainty).
- +3.40 mL/kg/min: gain in peak VO₂ (95% CI 2.98 to 3.83; 9 studies, 438 participants). A gain of this magnitude would correspond to a reduction of about 7% in the risk of hospitalisation for stroke.
On safety, the message is clear and reassuring: mortality was not influenced by any intervention (all risk differences equal to 0.00) and no serious adverse event was reported. The authors conclude that there is enough evidence to incorporate cardiorespiratory and mixed training, including walking, into post-stroke rehabilitation programmes 21.
Key points: walking and balance
- Have the task practised : repetitive task-oriented training gives +34.80 m of walking distance, maintained up to 6 months 13.
- Triage before plugging in a robot : ×2 odds of independent walking, but in non-ambulatory patients and within the first 3 months only, and always in association with physiotherapy 11.
- Do not forget exercise capacity : cardiorespiratory training reduces disability and improves balance, with no serious adverse event reported 21.
- Stay cautious about falls : possible reduction in the rate of falls (-28%), but not in the number of fallers, on low to very low-quality evidence 6.
- Work as a team : rehabilitation requires a sustained and coordinated effort from a large team including the patient and their family, and comprehensive programmes with resources and adequate dose and duration are an essential aspect of care, which must be a priority 3. Management in an organised stroke unit does, moreover, reduce the risk of a poor outcome by about 23% (OR 0.77; 95% CI 0.69 to 0.87; 29 trials, 5,902 participants) 2.
📋 Which complications should you anticipate?
📋 The complications to screen for systematically
None is rare. The physiotherapist, who sees the patient for a long time and often, is on the front line to spot them.
Pooled prevalences. Fatigue: Zhan 2023 (PMID 36314998, 66 studies); dysphagia: Song 2024 (PMID 39087010); neglect: Esposito 2021 (PMID 33246185, 41 studies, 38% after a right-hemisphere lesion against 18% after a left-hemisphere lesion); depression: Liu 2023 (PMID 36976794, 38% cumulative incidence at one year); spasticity: Zeng 2021 (PMID 33551975); shoulder pain: Anwer 2020 (PMID 32660109).
Rehabilitation after a stroke is not played out on motor recovery alone. Worldwide, 93.8 million people are living today with the after-effects of a stroke, for 11.9 million new cases in 2021 1 : behind these figures lie repetitive, predictable complications, often detectable before they take hold. The physiotherapist is frequently the clinician who sees the patient most often and for the longest: they are therefore on the front line to screen for them, even when their treatment is not their responsibility.
That is precisely the sense of the landmark AHA/ASA guidelines: post-stroke rehabilitation “requires a sustained and coordinated effort from a large team”, including the patient and their goals, their family, carers, doctors, nurses, physiotherapists, occupational therapists, speech and language therapists, psychologists, dietitians and social workers, and without communication and coordination, isolated efforts are unlikely to reach their full potential 3. Anticipating a complication does not mean treating it alone: it means seeing it, naming it, and passing it on to the right person.
Spasticity: a quarter of patients, but an identifiable risk profile
The meta-analysis by Zeng et al. 9 puts the prevalence of post-stroke spasticity at 25.3% across all strokes and at 26.7% after a first stroke. In patients with paresis, the incidence climbs to 39.5%. Severe or disabling spasticity (MAS ≥ 3) concerns 9.4% of paretic patients: the majority of spasticity is therefore not disabling, which argues against over-treating as a matter of course.
Above all, the risk factors are known and make it possible to target monitoring from the first weeks:
- Moderate to severe paresis, by far the dominant factor: OR = 6.573 (95% CI 2.579–16.755) 9 ;
- Haemorrhagic stroke: OR = 1.879;
- Sensory impairment, also significantly associated.
What to do. A patient combining marked paresis, haemorrhagic stroke and sensory deficit calls for close reassessment of tone, and a medical referral as soon as functional difficulty or pain appears: specific therapeutic decisions (drug treatments, injections) being a matter for the doctor within the multidisciplinary set-up described by Winstein 3.
Low-quality evidence What we cannot state here: the data presented concern the frequency and the risk factors of spasticity, not the comparative efficacy of the physiotherapy techniques intended to treat it (stretching, positioning, orthoses). We will therefore not settle that point: the reader should know that this question remains, in the sources used here, without a numerical answer.
Hemiplegic shoulder pain: up to one patient in two
Hemiplegic shoulder pain is one of the most frequent complications of hemiplegia. The review by Anwer and Alghadir 10 reports an incidence of 10 to 22% and a prevalence of 22 to 47%. The gap between these bounds is itself informative: the definition, the timing of measurement and the populations vary from one study to another. The exact figure is uncertain; the order of magnitude (it is frequent, very frequent) is not.
The predictors identified form a profile the physiotherapist can screen for early 10 : age, female sex, increased tone, sensory impairment, left hemiparesis, haemorrhagic stroke, spatial neglect, medical history and a high NIHSS score.
Increased tone + sensory deficit + neglect: three of the predictors of shoulder pain are themselves complications of stroke. Complications do not add up, they chain together.
What to do. Spot this risk profile from the initial assessment, track the appearance of pain, and alert the team. A patient with sensory impairment and neglect will not necessarily say that they are in pain, or not at the right moment.
Low-quality evidence Here too, caution: the data cited document frequency and predictors, not the efficacy of prevention strategies (set-up, positioning, supports, passive mobilisation). These practices are widespread; we do not have data here to rank them, and we prefer to say so rather than to imply a numerical consensus.
Unilateral spatial neglect: the trap of the normal “pen-and-paper” test
The meta-analysis by Esposito et al. 7, across 41 studies and 6,324 participants, finds an occurrence rate of spatial neglect of 29% after unilateral stroke, with a clear imbalance: 38% after a right-hemisphere lesion against 18% after a left-hemisphere one.
The most useful result for practice lies elsewhere. The mode of assessment changes the result twofold: ecological assessments, directly tied to activities of daily living, detect neglect in 53% of patients, against 24% with tests not directly linked to daily life 7.
| Type of assessment | Detection rate | Practical implication |
|---|---|---|
| Ecological assessment (linked to ADL) | 53 % | Better reflects the real-life impact |
| Tests not linked to daily activities | 24 % | A normal test does not rule out neglect |
| All assessments combined | 29 % | About 3 patients in 10 |
What to do. Never conclude that neglect is absent on the strength of a single tabletop test. A patient who correctly crosses out lines on a sheet of paper may ignore half of their plate, their wheelchair or the corridor. Observation in real situations (dressing, moving about, eating) is part of the assessment, and the physiotherapist, who works precisely in movement and in space, is well placed to produce it. This is typically information to pass on to the occupational therapist and the doctor 3.
Swallowing disorders: the complication that puts life at risk
The meta-analysis by Song et al. 4 gives a pooled prevalence of post-stroke dysphagia of 46.6% (95% CI 40.5–52.8), that is nearly one patient in two, with a clear gradient by stroke type: 58.8% after haemorrhage against 43.6% after ischaemia. The consequences are not trivial: among patients with dysphagia, 32.1% (95% CI 22.4–41.8) develop pneumonia, and mortality reaches 31.3% (95% CI 25.6–36.9) at one year.
What to do. Systematic swallowing screening is an integral part of the rehabilitation pathway 4. This field belongs to speech and language therapy, explicitly cited among the indispensable members of the team by the AHA/ASA guidelines 3 : the physiotherapist's role is not to assess swallowing in place of the speech and language therapist, but to avoid missing a signal (coughing at meals, a wet voice, recurrent chest congestion) and to pass it on without delay. A patient with a haemorrhagic stroke is, statistically, the one in whom vigilance must be highest.
Post-stroke fatigue: almost one survivor in two, and a dosing factor
Post-stroke fatigue affects 46.79% of survivors 5, with higher rates in women (53.19%) and after haemorrhagic stroke (57.54%). It is invisible, not measurable by eye, and regularly mistaken for a lack of motivation or poor adherence.
What to do. Build it into session planning (dosing, breaks, distribution of effort), rather than interpreting it as a lack of commitment 5. This requirement chimes with the main lesson of the AVERT trial: earlier and more intense is not automatically better. Across 2,104 patients in 56 stroke units, very early, high-dose mobilisation within 24 h reduced the chances of a favourable outcome at 3 months (mRS 0–2: 46% against 50%; adjusted OR 0.73; 95% CI 0.59–0.90; p = 0.004) 14. The prespecified dose-response analysis sharpens the message: increasing the daily frequency of out-of-bed episodes improves outcome (OR 1.13; 95% CI 1.09–1.18; p < 0.001), whereas increasing the number of minutes of mobilisation per day worsens it (OR 0.94; 95% CI 0.91–0.97; p < 0.001) 15. Shorter and more frequent sessions, then, not less rehabilitation.
Moderate evidence Conversely, physical fitness training is safe and useful: across 75 trials and 3,017 participants, cardiorespiratory training reduces disability (SMD 0.52; 95% CI 0.19–0.84; moderate certainty), no death was influenced by any intervention (all risk differences 0.00) and no serious adverse event was reported 21. Fatigue therefore does not mean a contraindication to exercise: it means dosed exercise.
Post-stroke depression: 38% in the first year, mostly within the first 3 months
The meta-analysis by Liu et al. 8 shows that 27% of patients are depressed at a given moment, and that the cumulative incidence reaches 38% over the first year. The timetable is decisive: 71% of depressions begin within the 3 months following the stroke (95% CI 65–76), that is, during the period when the patient sees their physiotherapist most often. Among patients depressed early, 53% (95% CI 47–59) remain depressed, while 44% (95% CI 38–50) recover.
What to do. The physiotherapist, who sees the patient closely and over a long period, is on the front line to spot these signs and refer 8. Spotting is not diagnosing: psychologists are part of the team described by the AHA/ASA guidelines 3, and it is to them and to the doctor that the information must be passed.
And falls: frequent, and a nuance that matters
Falls are one of the most frequent complications after a stroke, with a reported incidence ranging from 7% in the first week to 73% in the first year 6. Low-quality evidence Therapeutic exercise may reduce the rate of falls (rate ratio 0.72; 95% CI 0.54–0.94; 765 participants; low-quality evidence, i.e. about −28%), but it does not reduce the number of people who fall at least once (risk ratio 1.03; 95% CI 0.90–1.19; 969 participants; very low-quality evidence). In other words: exercise seems above all to protect repeat fallers, without preventing the first fall. The authors themselves express their uncertainty about this result: we will therefore not present it as settled.
Key points
- Spasticity: 25.3% (39.5% where there is paresis); dominant risk factor = moderate to severe paresis (OR 6.573) 9.
- Hemiplegic shoulder pain: prevalence 22–47%; a screenable risk profile (tone, sensory impairment, neglect, haemorrhage, high NIHSS) 10.
- Spatial neglect: 29% (38% where the lesion is right-sided); a normal tabletop assessment rules nothing out: ecological assessment detects 53% against 24% 7.
- Dysphagia: 46.6% (58.8% where there is haemorrhage); 32.1% pneumonia and 31.3% mortality at one year in those with dysphagia. Systematic screening, referral to speech and language therapy 4.
- Fatigue: 46.79%; it is a dosing parameter, not a failure of motivation. Shorter and more frequent sessions in the acute phase 515.
- Depression: 38% in the first year, 71% of cases beginning within the first 3 months: exactly the window in which the physiotherapist is most present 8.
- The common thread: none of these complications is treated solo. “Without communication and coordination, isolated rehabilitation efforts are unlikely to reach their full potential” 3.
A limit to own in front of the patient. The figures presented here describe populations, not individuals. The debate about the “proportional recovery rule” illustrates it: the correlation that founded it is confounded by mathematical coupling and by compression towards the ceiling of the scale, for individual as much as for group inference 17. Knowing that 46% of patients will be fatigued does not say whether the one in front of you will be. These prevalences serve to direct vigilance: they do not replace the assessment.
🗂️ What do concrete case studies teach us?
The data from the literature say what works “on average”. They never say what to do on Monday morning in front of a particular patient. The two cases that follow are entirely fictional : they describe no real patient, and have no value as evidence. They are supports for reasoning, built solely from the data presented above, to show how an assessment, a choice of technique, a progression and above all a dose fit together: including when the evidence is weak and this has to be said to the patient.
Fictional case no. 1: Mrs D., 72, acute phase, severely affected upper limb
Situation (fictional). Left middle cerebral artery ischaemic stroke. On day 2, marked right hemiparesis, upper limb with no active movement against gravity, patient non-ambulatory, aphasia, suspected aspiration on water. She is admitted to a stroke unit.
The assessment: what you look for, and why
The first reflex is not to treat, it is to situate. Three questions structure the initial assessment.
Where is she being managed? This is not incidental: management in an organised stroke unit, by a dedicated multidisciplinary team, reduces the risk of a poor outcome by about 23% (OR 0.77; 95% CI 0.69 to 0.87; 29 trials, 5,902 participants) and increases the chances of being alive, independent and at home a year later moderate evidence 2. The physiotherapist inherits a context that already weighs on the prognosis.
What can be expected of the arm? This is where the question of prognosis arises concretely. The PREP2 algorithm, developed on 207 patients recruited within 3 days of stroke, sequentially combines a measure of upper limb impairment, age, the presence or absence of motor evoked potentials recorded by transcranial magnetic stimulation, then MRI lesion load or the NIHSS score. It correctly predicts upper limb function at 3 months in 75 % of patients, the TMS biomarker being needed for only a third of them 18. It is today the best-validated upper limb prognostic tool, which does not mean infallible: one patient in four is misclassified.
What do you tell the family? The temptation is to invoke the famous “70% rule”. Caution. It comes from the study by Prabhakaran 16 on 41 patients: in the full sample, clinical variables explained only 47% of the variance in recovery; it was only after excluding the most severely affected patients, who recovered very poorly (the “non-fitters”), that the explained variance rose to 89% and that recovery approached 0.70 × initial deficit. The authors themselves concluded that clinical variables predict recovery only moderately. And Bowman 17 showed that the correlation which serves as the empirical proof of this rule is confounded by two statistical artefacts: mathematical coupling (the initial score appears on both sides of the correlation) and compression towards the ceiling of the Fugl-Meyer scale: a bias present for individual as much as for group inference. These authors call for new, unconfounded analysis techniques. Translation at the bedside: we do not promise 70%. An average trajectory does not predict the person in front of you.
Dosing: the mistake this case serves to avoid
Faced with a motivated patient and a pressing family, intuition says: start hard, right away. The AVERT trial says the opposite. Across 2,104 patients randomised in 56 stroke units in 5 countries, very early, frequent, high-dose mobilisation within 24 h produced fewer favourable outcomes at 3 months than usual care: modified Rankin Scale 0-2 in 480 patients (46%) against 525 (50%); adjusted OR 0.73 (95% CI 0.59 to 0.90; p = 0.004), with no reduction in immobility complications 14.
The prespecified dose-response analysis sharpens the message and makes it directly usable: increasing the daily frequency of out-of-bed sessions increases the chances of a good result (OR 1.13; 95% CI 1.09 to 1.18; p < 0.001), whereas increasing the number of minutes of mobilisation per day reduces them (OR 0.94; 95% CI 0.91 to 0.97; p < 0.001), after age and severity, frequency is the most decisive variable 15. Mrs D.'s plan follows from this: several short times out of bed across the day, rather than one long heroic session. This is not “less rehabilitation”, it is a different distribution.
The techniques, and their acknowledged limits
| Goal | Choice | What the evidence says |
|---|---|---|
| Walking again | Electromechanical/robotic training combined with physiotherapy | Doubles the odds of independent walking (OR 2.01; 95% CI 1.51 to 2.69; 38 studies, 1,567 participants) high quality ; benefit in non-ambulatory patients and within the first 3 months 11 |
| Plegic arm | Mirror therapy as an add-on | Effect on motor function (SMD 0.47; 95% CI 0.27 to 0.67; 36 studies) and motor impairment (SMD 0.49) moderate quality 27 |
| Plegic arm | Upper limb robot | Arm function SMD 0.32 (95% CI 0.18 to 0.46; 41 studies) high quality, but small effect sizes; no excess risk of dropout 28 |
| Plegic arm | CIMT: ruled out here | Presupposes residual use of the arm; effect demonstrated on motor function (SMD 0.34) but no convincing reduction in disability limited evidence 26 |
The choice of the gait robot for Mrs D. is explicitly conditional : it is the non-ambulatory profile, within the first three months, that draws benefit from it, patients who already walk do not 11. And the gain in speed remains modest (+0.06 m/s), with no gain in walking distance. It is used as an add-on to physiotherapy, never in its place.
What the physiotherapist does not treat, and does report
Suspected aspiration is not their responsibility, but they are often the first to see it: post-stroke dysphagia affects 46.6% of patients (95% CI 40.5 to 52.8), with 32.1% pneumonia among those with dysphagia and mortality of 31.3% at one year 4. Aphasia belongs to speech and language therapy. The AHA/ASA guidelines are unambiguous: rehabilitation requires a sustained and coordinated effort from a large team including the patient and their goals, the family, carers, doctors, nurses, physiotherapists, occupational therapists, speech and language therapists, psychologists, dietitians, social workers, and without communication and coordination, isolated efforts are unlikely to reach their full potential 3.
Key points: case no. 1
- Situate before you treat : PREP2 correctly predicts arm function at 3 months in 75% of patients 18, enough to calibrate a restoration/compensation goal, not enough to promise.
- Do not invoke the “70%” as a law: the rule rests on a study of 41 patients from which the non-fitters had been removed 16 and suffers from artefacts of mathematical coupling and a ceiling effect 17.
- Frequent and short, not long and intense in the acute phase: frequency of out-of-bed episodes OR 1.13, minutes per day OR 0.94 15 ; the ultra-early high dose did worse than usual care 14.
- The gait robot is conditional : benefit in non-ambulatory patients, as an add-on to physiotherapy 11.
Fictional case no. 2: Mr L., 58, 8 months after the stroke, walking, partially functional hand
Situation (fictional). Stroke 8 months ago. Walks alone indoors, tires quickly outdoors, two falls in three months, active wrist and finger extension possible but the arm is “forgotten” in everyday movements. Patient's goal: to walk to the bakery again and to do DIY with both hands.
The reasoning: the patient has changed, and so have the levers
Everything that held for Mrs D. no longer holds. Mr L. is ambulatory: the gait robot is not indicated for him 11. On the other hand, he has residual use of the arm, which opens up CIMT. And he is ambulatory, which opens up fitness training, one of the best-supported levers in post-stroke rehabilitation.
Dosing, honestly
Three pieces of data have to be set side by side, because they do not tell quite the same story, and it is useful to say so.
On one side, repetitive task-oriented training really does improve function, modestly but consistently: walking distance +34.80 m (95% CI 18.19 to 51.41; 9 studies, 610 participants) moderate quality, arm function SMD 0.25 (95% CI 0.01 to 0.49) low quality, benefits maintained up to 6 months after treatment but not beyond 13.
On the other, dose is not a magic button. In that same review, the effects were modified neither by the type of intervention, nor by the dose of practice, nor by the time since stroke 13. A phase II trial tested the question head-on: 85 adults more than 6 months after a stroke, randomised into 4 doses (3,200, 6,400, 9,600 repetitions, or an individualised maximum), 1 hour per session, 4 days a week, 8 weeks, no dose-response effect, effects small overall 24. Multiplying the repetitions threefold in the chronic phase is not enough.
And yet dose counts somewhere: increasing the amount of usual rehabilitation improves activities (SMD 0.39; 95% CI 0.07 to 0.71), with a strengthened effect beyond +100% of additional therapy (SMD 0.59; 95% CI 0.23 to 0.94), the ROC analysis placing the useful threshold at at least +240 % 23. This apparent contradiction must be stated to the patient just as it is : a few more repetitions per session will change nothing; only a change in order of magnitude weighs, and it is not always attainable. To be set alongside the observation of 312 timed sessions: practice of functional upper limb movement occurred in only 51% of the sessions targeting the upper limb, with 32 repetitions on average (95% CI 20 to 44), against 357 steps per session for the lower limb: a low dose set against animal models of plasticity 22.
The programme, and what is promised of it
- Fitness training: the pillar. Cardiorespiratory training reduces disability (SMD 0.52; 95% CI 0.19 to 0.84; 8 studies, 462 participants) moderate certainty and increases peak VO2 by 3.40 mL/kg/min; no excess mortality, no serious adverse event across 75 trials and 3,017 participants 21. It is safe, and it is one of the rare interventions that touches disability itself.
- Circuit training for walking: +60.86 m on the 6-minute test (95% CI 44.55 to 77.17) and +0.15 m/s of speed moderate: two effects considered clinically significant. Vigilance: an excess risk of falls during sessions cannot be ruled out (RD 0.03; 95% CI −0.02 to 0.08) 20.
- CIMT for the arm, with a calibrated message. The seminal EXCITE trial (222 patients, 3 to 9 months after the stroke) showed at 12 months a 52% reduction in performance time on the Wolf Motor Function Test against 26% under usual care (difference 34%, p < 0.001) and gains on the Motor Activity Log (+0.43 points of amount of use, +0.48 of quality, p < 0.001) 19. But the Cochrane review of 42 trials tempers this: effect on arm motor function SMD 0.34 (95% CI 0.12 to 0.55), effect on disability non-significant (SMD 0.24; 95% CI −0.05 to 0.52) and no benefit at follow-up (SMD −0.20; 95% CI −0.57 to 0.16) benefit on disability not demonstrated 26. What we tell Mr L.: “your arm will probably move better; that this changes your daily life is not demonstrated”.
- Virtual reality : as an add-on to usual care only (SMD 0.42; 95% CI 0.26 to 0.58; 21 studies) moderate certainty ; as a replacement for another therapy, the gain is only slight (SMD 0.20) low certainty 29.
Falls, fatigue, mood: the off-camera matters that decide everything
Mr L.'s two falls are not a detail: the incidence of falls ranges from 7% in the first week to 73% in the first year 6. Exercise may reduce the rate of falls (rate ratio 0.72; 95% CI 0.54 to 0.94) low quality but does not reduce the number of people who fall at least once (RR 1.03; 95% CI 0.90 to 1.19) very low: the uncertainty is real and must be stated: exercise seems above all to protect repeat fallers.
His fatigue is not a failure of motivation: post-stroke fatigue affects 46.79% of survivors (95% CI 43.41 to 50.18; 66 studies, 11,697 patients) 5. It is planned for (breaks, distribution of effort), it is not lectured away. And the physiotherapist, who sees him closely and over a long period, is on the front line to spot depression: 27% prevalence (95% CI 25 to 30), 38% cumulative incidence in the first year, of which 71% begin within 3 months 8. In a patient with paresis, spasticity is also waiting (incidence 39.5%; moderate to severe paresis: OR 6.573) 9, as is hemiplegic shoulder pain (prevalence 22 to 47%) 10.
Key points: case no. 2
- The profile dictates the technique : ambulatory → no gait robot 11 ; residual use of the arm → CIMT possible; ambulatory → fitness training, the best-supported lever on disability 21.
- Dose is a contradictory subject, and we say so : no dose-response effect in the chronic phase 2413, but a useful threshold estimated at +240% of additional rehabilitation 23.
- Do not oversell CIMT : real motor gains 1926, reduction in disability not demonstrated 26.
- Falls, fatigue, mood govern adherence as much as the programme itself, and the uncertainty about the anti-fall effect of exercise has to be owned 6.
What these two fictional cases have in common
Nothing in the choice of techniques came from a school preference. Everything came from three questions: which phase this patient is in, what they can already do, and what dose is actually deliverable. The AHA/ASA guidelines say nothing else: the provision of comprehensive rehabilitation programmes, with resources and adequate dose and duration, is an essential aspect of stroke care and must be a priority 3. At population level the stakes are massive: 11.9 million new strokes in 2021 and 93.8 million people living with the after-effects, 3rd leading cause of death (7.3 million, 10.7% of deaths) and 4th leading cause of DALYs (160.5 million, 5.6% of the total) 1.
And the most honest conclusion remains this one: physical rehabilitation, combining several treatment components, probably improves recovery of function and mobility after a stroke: across 267 trials and 21,838 participants in 36 countries 25. “Probably”, “several components”: that is exactly the level of certainty to work with, and exactly what should be said to the patient.
🧭 How do you apply this concretely in practice?
The post-stroke literature is abundant, but it does not say “do this”. It says rather: here is what works a little, here is what does not work the way we believed, and here is what we still do not know. This section offers an honest clinical translation of these data, without overselling them.
A six-step reasoning algorithm
There is no validated decision tree for post-stroke rehabilitation as a whole. What follows is a practical ordering of the available data, not an official recommendation.
1. Locate the phase. The question “where are we?” governs almost everything else. In the acute phase (first 24 hours), the AVERT trial (2,104 patients, 56 stroke units, 5 countries), showed that a protocol of very early, high-dose mobilisation reduces the chances of a favourable outcome at 3 months: 46% modified Rankin Scale scores of 0-2 against 50% under usual care, adjusted OR 0.73 (95% CI 0.59-0.90; p = 0.004), with no reduction in immobility complications 14. Solid evidence, and counter-intuitive.
2. Dose before you intensify. AVERT's prespecified dose-response analysis separates two parameters that are readily confused. Increasing the daily frequency of out-of-bed episodes improves outcome (OR 1.13; 95% CI 1.09-1.18; p < 0.001); increasing the number of minutes of mobilisation per day worsens it (OR 0.94; 95% CI 0.91-0.97; p < 0.001) 15. The message is not “less rehabilitation” but: shorter and more frequent sessions in the acute phase.
3. Estimate the upper limb prognosis early. The PREP2 algorithm, developed on 207 patients recruited within 3 days of stroke (median age 72 years, 18-98 years), sequentially combines a measure of upper limb impairment, age, the presence or absence of motor evoked potentials recorded by transcranial magnetic stimulation (TMS), and MRI lesion load or the NIHSS score. It correctly predicts upper limb function at 3 months in 75% of patients, the TMS biomarker being needed for only a third of them 18. It is today the best-validated prognostic tool: it makes it possible to calibrate the goals (restoration vs compensation) rather than flying blind. Note, however: 75% correct predictions also means one patient in four misclassified. PREP2 guides a conversation, it does not close a file.
4. Choose the documented levers. The largest Cochrane review on the subject (267 trials, 21,838 participants, 36 countries) concludes that physical rehabilitation, combining several treatment components, probably improves recovery of function and mobility: independence in activities of daily living SMD 1.32 (95% CI 1.08-1.56), motor function SMD 1.01 (95% CI 0.80-1.22), walking speed SMD 0.23 (95% CI 0.05-0.42) compared with no rehabilitation 25. The level of certainty nevertheless remains low to moderate depending on the outcome.
5. Retrain exercise capacity: the most under-used lever. Across 75 trials and 3,017 participants, mostly ambulatory, cardiorespiratory training reduces disability (SMD 0.52; 95% CI 0.19-0.84; moderate certainty) and increases peak VO2 by 3.40 mL/kg/min (95% CI 2.98-3.83); mixed training also reduces disability, more modestly (SMD 0.23; 95% CI 0.03-0.42; low certainty). No death was influenced by any intervention (all risk differences 0.00) and no serious adverse event was reported 21. Moderate certainty, and reassuring safety. The authors explicitly conclude that there is enough evidence to incorporate cardiorespiratory and mixed training, including walking, into post-stroke rehabilitation programmes.
6. Reassess, and accept changing the goal. None of the available tools removes the need for regular reassessment: individual trajectories are far less predictable than group averages suggest (see below).
What to choose, for whom: what the figures say
| Intervention | Measured effect | For whom, concretely | Level |
|---|---|---|---|
| Repetitive task-oriented training (RTT) | Walking distance +34.80 m (95% CI 18.19-51.41; 9 studies, n = 610); arm function SMD 0.25 (95% CI 0.01-0.49; 11 studies, n = 749); maintained up to 6 months, not beyond 13 | Broad. Notable point: the effects were modified neither by the type of intervention, nor by the dose of practice, nor by the time since stroke | Moderate (walking) / Low (arm) |
| Robotic / electromechanical gait training + physiotherapy | ×2 the odds of independent walking (OR 2.01; 95% CI 1.51-2.69; 38 studies, n = 1,567; I² = 0%); speed +0.06 m/s; no gain in walking distance 11 | Patients non-ambulatory at the start and within the first 3 months. Patients who already walk do not benefit from it | High |
| Circuit training (group) | 6-minute test +60.86 m (95% CI 44.55-77.17); speed +0.15 m/s; TUG −3.62 s 20 | Ambulatory patients. Monitor falls: excess risk not ruled out (RD 0.03; 95% CI −0.02 to 0.08) | Moderate |
| Mirror therapy | Motor function SMD 0.47 (95% CI 0.27-0.67; n = 1,173); ADL SMD 0.48 27 | Upper limb, as an add-on to conventional rehabilitation | Moderate |
| Upper limb robotics | ADL SMD 0.31; arm function SMD 0.32; strength SMD 0.46 (45 trials, n = 1,619); no excess dropouts 28 | Small effect sizes, but high-quality evidence and good tolerance | High (small effects) |
| Virtual reality | Alone vs alternative therapy: SMD 0.20. Added to usual care: SMD 0.42 (95% CI 0.26-0.58; 21 studies, n = 689) 29 | Add-on, never substitute. Adverse effects rare and mild | Moderate (as an add-on) |
| Functional electrical stimulation (FES) of the arm | No overall benefit on ADL (SMD 0.64; 95% CI −0.02 to 1.30). Started < 2 months: SMD 1.24 (n = 32). Started > 1 year: SMD −0.10 12 | Signal in favour of an early window, but very low GRADE on all the analyses: no firm conclusion possible | Very low |
Key messages to pass on to the patient and their family
- “Rehabilitation is not an optional extra.” The AHA/ASA guidelines state that the provision of comprehensive programmes, with resources and adequate dose and duration, is an essential aspect of stroke care and must be a priority 3.
- “Move early, yes; exhaust yourself early, no.” Explaining AVERT in one sentence: short, frequent sessions rather than long ones in the acute phase 15.
- “Moving will not put you in danger.” Across 75 trials and 3,017 participants, no death was influenced by an exercise intervention and no serious adverse event was reported 21. That sentence defuses a great many family fears.
- On CIMT, be honest. Across 42 trials and 1,453 participants, constraint-induced therapy improves arm motor function (SMD 0.34; 95% CI 0.12-0.55; p = 0.004; 28 studies, n = 858), but the effect on disability is not significant (SMD 0.24; 95% CI −0.05 to 0.52) and no benefit is demonstrated at follow-up (SMD −0.20; 95% CI −0.57 to 0.16). The authors conclude that these benefits “did not convincingly reduce disability” 26. The seminal EXCITE trial (222 patients, 3 to 9 months post-stroke) nevertheless remains impressive at 12 months: −52% of time on the Wolf Motor Function Test against −26% under usual care, between-group difference 34% (p < 0.001) 19. Say both things : the arm moves better; that daily life is transformed by it is not demonstrated.
- “The famous 70%: be wary.” The proportional recovery rule comes from Prabhakaran 16 : on 41 patients, after excluding the most severely affected, who recovered very poorly, the explained variance rose to 89% and recovery ≈ 0.70 × initial deficit. But Bowman 17 shows that the correlation which serves as empirical proof is confounded by two artefacts, mathematical coupling (the initial score appears on both sides) and compression towards the Fugl-Meyer ceiling, for individual as much as for group inference, and concludes that new analysis techniques are needed. The average trajectory does not predict the patient in front of you.
Common mistakes
- Believing that you are doing enough. The seminal observational study timed 312 post-stroke physiotherapy and occupational therapy sessions: practice of functional upper limb movement occurred in only 51% of the sessions targeting the upper limb, with an average of 32 repetitions per session (95% CI 20-44); walking was practised in 84% of sessions, with 357 steps on average (95% CI 296-418). The authors conclude that this dose is low set against animal models of plasticity 22.
- Believing, conversely, that it is enough to pile up repetitions. A phase II trial randomised 85 adults more than 6 months after a stroke into 4 dose groups (3,200, 6,400, 9,600 repetitions, or an individualised maximum), 1 h/session, 4 days/week, 8 weeks: no dose-response effect on functional capacity, effects small overall 24. And Schneider 23 places the useful threshold for added rehabilitation at at least +240% (overall effect SMD 0.39; 95% CI 0.07-0.71; strengthened beyond +100%: SMD 0.59). A few extra minutes per session do not change the outcome.
- Confusing earlier with better. See AVERT. It is not early mobilisation in itself that did harm, but excessive early intensity.
- Relying on a pen-and-paper assessment to rule out neglect. Across 41 studies and 6,324 participants, unilateral spatial neglect occurs in 29% of patients (38% after a right-hemisphere lesion, 18% after a left-hemisphere lesion); ecological assessments linked to ADL detect far more of it than tabletop tests (53% vs 24%) 7.
- Taking fatigue for a lack of motivation. Across 66 studies and 11,697 patients, the pooled prevalence of post-stroke fatigue is 46.79% (95% CI 43.41-50.18), higher in women (53.19%) and after haemorrhagic stroke (57.54%) 5. It is planned for (dosing, breaks, distribution of effort), it is not lectured away.
- Prescribing a gait robot to a patient who already walks. The benefit concerns non-ambulatory patients and the first 3 months 11.
Working as a team: this is not a form of politeness
The AHA/ASA guidelines are explicit: post-stroke rehabilitation requires a sustained and coordinated effort from a large team: the patient and their goals, the family, carers, doctors, nurses, physiotherapists, occupational therapists, speech and language therapists, psychologists, dietitians, social workers. “Without communication and coordination, isolated rehabilitation efforts are unlikely to reach their full potential” 3. The physiotherapist is one link, not the whole system.
This is not only a principle: organisation counts, measurably. Across 29 trials and 5,902 participants, management in an organised stroke unit reduces the risk of a poor outcome by about 23% (OR 0.77; 95% CI 0.69-0.87), patients being more often alive, independent and living at home one year after the stroke 2.
Three referral partners to know by heart: the speech and language therapist: the pooled prevalence of post-stroke dysphagia is 46.6% (95% CI 40.5-52.8), 58.8% after haemorrhagic stroke, with 32.1% pneumonia and 31.3% mortality at one year in patients with dysphagia 4 ; the occupational therapist for transfer into ADL; the doctor for everything that follows.
When to refer on
- Spasticity that sets in or worsens. Pooled prevalence 25.3% after stroke, 26.7% after a first stroke, and 39.5% in paretic patients; 9.4% develop severe or disabling spasticity. Main risk factor: moderate to severe paresis (OR 6.573; 95% CI 2.579-16.755), ahead of haemorrhagic stroke and sensory impairment 9. These criteria identify the patients to watch closely.
- Hemiplegic shoulder pain. Incidence 10-22%, prevalence 22-47%. Predictors: age, female sex, increased tone, sensory impairment, left hemiparesis, haemorrhagic stroke, spatial neglect, high NIHSS score 10: a risk profile that can be screened for from the very first sessions.
- Depressive signs. 27% of patients are depressed at a given moment (95% CI 25-30) and the cumulative incidence over the first year reaches 38% (95% CI 33-43); 71% of episodes begin within 3 months, and 53% of patients depressed early remain so 8. The physiotherapist, who sees the patient closely and over a long period, is often the first to spot it.
- Repeated falls. The reported incidence ranges from 7% in the first week to 73% in the first year. Exercise may reduce the rate of falls (rate ratio 0.72; 95% CI 0.54-0.94; low-quality evidence) without reducing the number of people falling at least once (RR 1.03; very low-quality evidence) 6: it seems above all to protect repeat fallers, but the uncertainty is real.
- Any suspected dysphagia : refer without delay 4.
Key points
- Dose it, do not just start early. AVERT: very early, high-dose mobilisation reduces good outcomes at 3 months (46% vs 50%; adjusted OR 0.73; p = 0.004). Short, frequent sessions rather than long ones (frequency OR 1.13; minutes/day OR 0.94).
- The usual dose is low 22, but piling up repetitions is not enough 24 and the useful threshold for added rehabilitation is at least +240% 23.
- Three robust levers: cardiorespiratory fitness training (disability SMD 0.52; peak VO2 +3.40 mL/kg/min; safe), task-oriented training (+34.8 m of walking distance), gait robot as an add-on in non-ambulatory patients within the first 3 months (OR 2.01).
- Honesty about CIMT: the arm moves better (SMD 0.34), the reduction in disability is not demonstrated.
- The 70% is not a law : the correlation that founds it is confounded by mathematical coupling and by a ceiling effect 17. PREP2 (75% correct predictions at 3 months) guides: it does not decide.
- Screen beyond the motor system: dysphagia (46.6%), fatigue (46.8%), depression (38% at 1 year), neglect (29%, under-detected on tabletop testing), spasticity (25.3%), shoulder pain (22-47%).
- Never alone: the organised stroke unit reduces the risk of a poor outcome by about 23% (OR 0.77). Coordination is a treatment.
“Without communication and coordination, isolated rehabilitation efforts are unlikely to reach their full potential.”, Winstein et al., Stroke, 2016
A last word on uncertainty, which is not an admission of weakness but a clinical datum. The effects reported above are, in the vast majority, of small size and of low to moderate certainty. Several central questions remain open: the optimal therapeutic window for FES is undetermined 12, the effective dose in the chronic phase remains nowhere to be found 2413, and individual prediction of recovery has no unbiased tool 17. Faced with this, the defensible attitude is not to decide in order to reassure, but to say so, and to reassess often.
References
Every reference individually verified on PubMed (clickable PMID). 29 sources. Click a superscript note marker in the text: the reference list opens and highlights the source.
- GBD 2021 Stroke Risk Factor Collaborators (2024). The Lancet Neurology. PMID 39304265. doi:10.1016/S1474-4422(24)00369-7.
- Langhorne P, Ramachandra S; Stroke Unit Trialists' Collaboration (2020). Cochrane Database of Systematic Reviews. PMID 32324916. doi:10.1002/14651858.CD000197.pub4.
- Winstein CJ, Stein J, Arena R, Bates B, Cherney LR, Cramer SC, Deruyter F, Eng JJ, Fisher B, Harvey RL, Lang CE, MacKay-Lyons M, Ottenbacher KJ, Pugh S, Reeves MJ, Richards LG, Stiers W, Zorowitz RD; American Heart Association Stroke Council (2016). Stroke. PMID 27145936. doi:10.1161/STR.0000000000000098.
- Song W, Wu M, Wang H, Pang R, Zhu L (2024). Frontiers in Neurology. PMID 39087010. doi:10.3389/fneur.2024.1403610.
- Zhan J, Zhang P, Wen H, Wang Y, Yan X, Zhan L, Chen H, Xu N, Lu L (2023). International Journal of Stroke. PMID 36314998. doi:10.1177/17474930221138701.
- Denissen S, Staring W, Kunkel D, Pickering RM, Lennon S, Geurts ACH, Weerdesteyn V, Verheyden GSAF (2019). Cochrane Database of Systematic Reviews. PMID 31573069. doi:10.1002/14651858.CD008728.pub3.
- Esposito E, Shekhtman G, Chen P (2021). Annals of Physical and Rehabilitation Medicine. PMID 33246185. doi:10.1016/j.rehab.2020.10.010.
- Liu L, Xu M, Marshall IJ, Wolfe CDA, Wang Y, O'Connell MDL (2023). PLoS Medicine. PMID 36976794. doi:10.1371/journal.pmed.1004200.
- Zeng H, Chen J, Guo Y, Tan S (2021). Frontiers in Neurology. PMID 33551975. doi:10.3389/fneur.2020.616097.
- Anwer S, Alghadir A (2020). International Journal of Environmental Research and Public Health. PMID 32660109. doi:10.3390/ijerph17144962.
- Mehrholz J, Thomas S, Kugler J, Pohl M, Elsner B (2020). Cochrane Database of Systematic Reviews. PMID 33091160. doi:10.1002/14651858.CD006185.pub5.
- Eraifej J, Clark W, France B, Desando S, Moore D (2017). Systematic Reviews. PMID 28245858. doi:10.1186/s13643-017-0435-5.
- French B, Thomas LH, Coupe J, McMahon NE, Connell L, Harrison J, Sutton CJ, Tishkovskaya S, Watkins CL (2016). Cochrane Database of Systematic Reviews. PMID 27841442. doi:10.1002/14651858.CD006073.pub3.
- AVERT Trial Collaboration group (Bernhardt J, Langhorne P, Lindley RI, et al.) (2015). The Lancet. PMID 25892679. doi:10.1016/S0140-6736(15)60690-0.
- Bernhardt J, Churilov L, Ellery F, Collier J, Chamberlain J, Langhorne P, Lindley RI, Moodie M, Dewey H, Thrift AG, Donnan G, AVERT Collaboration Group (2016). Neurology. PMID 26888985. doi:10.1212/WNL.0000000000002459.
- Prabhakaran S, Zarahn E, Riley C, Speizer A, Chong JY, Lazar RM, Marshall RS, Krakauer JW (2008). Neurorehabilitation and Neural Repair. PMID 17687024. doi:10.1177/1545968307305302.
- Bowman H, Bonkhoff A, Hope T, Grefkes C, Price C (2021). Stroke. PMID 33827246. doi:10.1161/STROKEAHA.120.033031.
- Stinear CM, Byblow WD, Ackerley SJ, Smith MC, Borges VM, Barber PA (2017). Annals of Clinical and Translational Neurology. PMID 29159193. doi:10.1002/acn3.488.
- Wolf SL, Winstein CJ, Miller JP, Taub E, Uswatte G, Morris D, Giuliani C, Light KE, Nichols-Larsen D; EXCITE Investigators (2006). JAMA. PMID 17077374. doi:10.1001/jama.296.17.2095.
- English C, Hillier SL, Lynch EA (2017). Cochrane Database of Systematic Reviews. PMID 28573757. doi:10.1002/14651858.CD007513.pub3.
- Saunders DH, Sanderson M, Hayes S, Johnson L, Kramer S, Carter DD, Jarvis H, Brazzelli M, Mead GE (2020). Cochrane Database of Systematic Reviews. PMID 32196635. doi:10.1002/14651858.CD003316.pub7.
- Lang CE, Macdonald JR, Reisman DS, Boyd L, Kimberley TJ, Schindler-Ivens SM, Hornby TG, Ross SA, Scheets PL (2009). Archives of Physical Medicine and Rehabilitation. PMID 19801058. doi:10.1016/j.apmr.2009.04.005.
- Schneider EJ, Lannin NA, Ada L, Schmidt J (2016). Journal of Physiotherapy. PMID 27637769. doi:10.1016/j.jphys.2016.08.006.
- Lang CE, Strube MJ, Bland MD, Waddell KJ, Cherry-Allen KM, Nudo RJ, Dromerick AW, Birkenmeier RL (2016). Annals of Neurology. PMID 27447365. doi:10.1002/ana.24734.
- Todhunter-Brown A, Sellers CE, Baer GD, Choo PL, Cowie J, Cheyne JD, Langhorne P, Brown J, Morris J, Campbell P (2025). Cochrane Database of Systematic Reviews. PMID 39932103. doi:10.1002/14651858.CD001920.pub4.
- Corbetta D, Sirtori V, Castellini G, Moja L, Gatti R (2015). Cochrane Database of Systematic Reviews. PMID 26446577. doi:10.1002/14651858.CD004433.pub3.
- Thieme H, Morkisch N, Mehrholz J, Pohl M, Behrens J, Borgetto B, Dohle C (2018). Cochrane Database of Systematic Reviews. PMID 29993119. doi:10.1002/14651858.CD008449.pub3.
- Mehrholz J, Pohl M, Platz T, Kugler J, Elsner B (2018). Cochrane Database of Systematic Reviews. PMID 30175845. doi:10.1002/14651858.CD006876.pub5.
- Laver KE, Lange B, George S, Deutsch JE, Saposnik G, Chapman M, Crotty M (2025). Cochrane Database of Systematic Reviews. PMID 40537150. doi:10.1002/14651858.CD008349.pub5.
❓ Frequently asked questions
Should you mobilise as early and as intensively as possible after a stroke?
No. The AVERT trial (2,104 patients, 56 stroke units, 5 countries) compared very early, frequent, high-dose mobilisation within 24 h with usual care: the very early mobilisation group had FEWER favourable outcomes at 3 months (modified Rankin Scale 0-2: 46% against 50%; adjusted OR 0.73; 95% CI 0.59-0.90; p = 0.004), with no reduction in immobility complications 14. The prespecified dose-response analysis separates frequency from duration: increasing the daily frequency of out-of-bed sessions increases the chances of a good result (OR 1.13; 95% CI 1.09-1.18; p < 0.001), whereas increasing the number of minutes of mobilisation per day reduces them (OR 0.94; 95% CI 0.91-0.97; p < 0.001) 15. The message is not “less rehabilitation”, nor “wait”, but shorter and more frequent sessions in the acute phase: you have to dose, not merely start early.
Does the 70% rule make it possible to predict my patient's recovery?
No, not at the individual level. The proportional recovery rule comes from the study by Prabhakaran 16, conducted on 41 ischaemic patients assessed with the upper limb Fugl-Meyer between 24 and 72 hours and then at 3 or 6 months: in the full sample, clinical variables explained only 47% of the variance in recovery; it was only after excluding a subgroup of the most severely affected patients, who recovered very poorly (the “non-fitters”), that the explained variance rose to 89%, with recovery approximated by recovery ≈ 0.70 × initial deficit 16. But Bowman 17 shows that the strong negative correlation between initial score and change, which serves as the empirical proof of this rule, is confounded by two statistical artefacts: mathematical coupling (the initial score appears on both sides of the correlation) and compression towards the ceiling of the scale (the ceiling effect of the Fugl-Meyer), a bias present for individual as much as for group inference 17. The average trajectory does not predict the patient in front of you.
How can the upper limb prognosis be estimated within the first few days?
With the PREP2 algorithm, the best-validated upper limb prognostic tool to date. It was developed from 207 patients recruited within 3 days of stroke (103 women, i.e. 50%; median age 72 years, range 18-98 years) using classification and regression tree analysis. It sequentially combines a measure of upper limb impairment, age, the presence or absence of motor evoked potentials recorded by transcranial magnetic stimulation (TMS), then MRI lesion load or stroke severity assessed by the NIHSS score. The algorithm correctly predicts upper limb function at 3 months in 75% of patients, and the TMS biomarker is needed for only a third of them 18. It is a tool for calibrating rehabilitation goals, restoration versus compensation, instead of flying blind.
Does constraint-induced movement therapy (CIMT) really reduce disability?
It improves arm motor function, but without convincing evidence that it reduces disability in daily life. The Cochrane review by Corbetta (42 trials, 1,453 participants) finds a significant but modest effect on arm motor function (SMD 0.34; 95% CI 0.12-0.55; p = 0.004; 28 studies, 858 participants), whereas the effect on disability at the end of the intervention is not significant (SMD 0.24; 95% CI -0.05 to 0.52; 11 trials, 344 participants) and no benefit is demonstrated at follow-up (SMD -0.20; 95% CI -0.57 to 0.16; 3 studies, 125 participants); the authors conclude that there are limited improvements in impairment and motor function, without convincing reduction in disability 26. The seminal EXCITE trial (222 patients, 3 to 9 months after the stroke, 7 centres) nevertheless remains solid: two weeks of constraining the unaffected limb with repeated task practice produced, at 12 months, a 52% reduction in performance time on the Wolf Motor Function Test against 26% under usual care (between-group difference of 34%, p < 0.001), with +0.43 points on the Motor Activity Log “amount of use” and +0.48 points on “quality of movement” (p < 0.001) 19. To be stated honestly to the patient.
For whom is robot-assisted gait rehabilitation indicated?
Above all for those who do not yet walk. The Cochrane review by Mehrholz (62 trials, 2,440 participants) shows that electromechanical/robotic gait training, IN COMBINATION with physiotherapy and not in its place, doubles the odds of becoming independent in walking again (OR 2.01; 95% CI 1.51-2.69; 38 studies, 1,567 participants; p < 0.00001; I² = 0%; high-quality evidence), with a modest gain in walking speed (+0.06 m/s; 95% CI 0.02-0.10; low-quality evidence) and no gain in walking capacity (+10.9 m on the 6-minute test; 95% CI -5.7 to 27.4; p = 0.2). Key point for prescribing: it is patients who are non-ambulatory at the start of the intervention and those in the first three months after the stroke who benefit: patients who already walk do not 11. For the upper limb, the evidence is of high quality but for small effect sizes: activities of daily living SMD 0.31 (95% CI 0.09-0.52), arm function SMD 0.32 (95% CI 0.18-0.46; p < 0.0001), muscle strength SMD 0.46 (95% CI 0.16-0.77), with no increase in the risk of dropout (RD 0.00; 95% CI -0.02 to 0.02) 28.
Is fitness training safe and useful after a stroke?
Yes, on both counts. The Cochrane review by Saunders (75 trials, 3,017 participants, mostly ambulatory) shows that cardiorespiratory training reduces disability (SMD 0.52; 95% CI 0.19-0.84; 8 studies, 462 participants; moderate certainty) and increases peak VO2 by 3.40 mL/kg/min (95% CI 2.98-3.83; 9 studies, 438 participants): a magnitude of gain that would correspond to a reduction of about 7% in the risk of hospitalisation for stroke. Mixed training also reduces disability (SMD 0.23; 95% CI 0.03-0.42; low certainty), with benefits for physical fitness, walking speed and balance. On safety, no death was influenced by any intervention (all risk differences equal to 0.00) and there was no evidence of any serious adverse event. The authors conclude that there is enough evidence to incorporate cardiorespiratory and mixed training, including walking, into post-stroke rehabilitation programmes 21. Circuit training points the same way: +60.86 m on the 6-minute test (95% CI 44.55-77.17) and +0.15 m/s of walking speed (95% CI 0.10-0.19), with an excess risk of falls during sessions not ruled out (RD 0.03; 95% CI -0.02 to 0.08) to be monitored 20.
Which non-motor complications should be screened for systematically?
They are frequent and they shape the session. Dysphagia affects 46.6% of patients (95% CI 40.5-52.8), more after haemorrhagic stroke (58.8%) than after ischaemic stroke (43.6%), with 32.1% pneumonia among those with dysphagia and mortality of 31.3% at one year 4. Post-stroke fatigue concerns 46.79% of survivors (95% CI 43.41-50.18), more in women (53.19%) and after haemorrhagic stroke (57.54%): to be built into dosing and breaks, not interpreted as a lack of motivation 5. Depression concerns 27% of patients (95% CI 25-30), with a cumulative incidence of 38% over the first year and 71% of episodes beginning within 3 months 8. Unilateral spatial neglect affects 29% of patients (38% after a right-hemisphere lesion, 18% after a left-hemisphere lesion) and ecological assessments detect it far better than tabletop tests (53% vs 24%): a normal pen-and-paper assessment does not rule it out 7. To these are added spasticity (25.3%, of which 9.4% are severe or disabling forms in paretic patients, moderate to severe paresis being the main risk factor, OR 6.573; 95% CI 2.579-16.755) 9, hemiplegic shoulder pain (prevalence 22 to 47%) 10 and falls, whose rate exercise may reduce (rate ratio 0.72; 95% CI 0.54-0.94) without reducing the number of people who fall at least once (risk ratio 1.03; 95% CI 0.90-1.19) 6.
Also worth reading in the review